 |
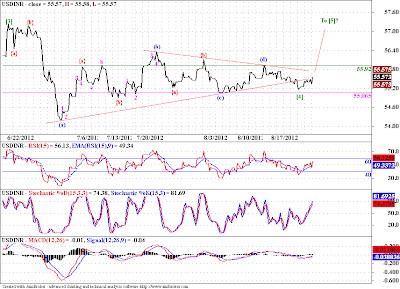
| 4 Hourly Chart |
I had proposed three possible outcomes from this range bound action on USDINR. I feel if we take out 55.92, we might well be on our way to play out the possibility shown on the chart above. Which means we have to take out the top of wave [3] around 57 odd levels, as our minimum target for wave [5]. On the other had if we get resisted around the 55.92 levels, then we may see prices going down to much lower levels, two possibilities were marked on the chart in our last post, refer it here.. We are still in the range of 55.92-55.00, so unless we get a break on the either side, we wont see a price expansion.


the whole consolidation phase from 07/2012 to till date is emerging as a diametric with a next leg down whats ur say.
ReplyDeleteI am not aware of the "Diametric", but I am counting it as a triangle. But as always EWP gives us multiple possibilities, and market would choose one of it. That's uncertainty for you, and you have to learn to live with it.
Delete