 |
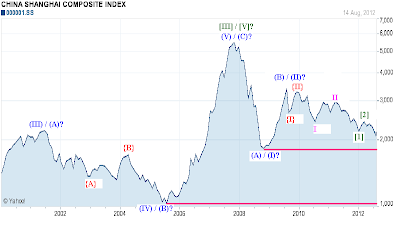
This is chart for Shanghai Index. We may have put in an important top around 2008. There are a couple of possibilities, which are duly marked on the chart. Following the top in this index, we have fallen hard and completed wave (A) and (B) already. The development following wave (B) is very interesting. Prices have formed a series of 1-2/1-2 waves, and we may be just be in the process of accelerating downwards, the minimum target would be the low of wave (A), and ideally should target the terminal point of wave (IV), which comes around 1000 levels, this may happen if we breakdown below the wave (A) terminus.


The chart is really scary. Really appreciate you for bringing to light a different index, and such clear wave count.
ReplyDeleteThanks
Thanks for your comments. This chart was posted in response to a request by a dear friend. And the whole global scenario is getting scarier by the day.
DeleteRegards