Saturday, October 27, 2012

Nifty, 10 Y GOI Bond - Technical Update

10 Y GOI Bond
Nifty
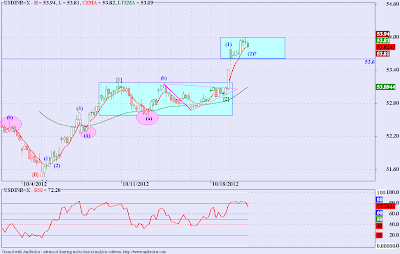
I was looking at the 10Y GOI Bond Yield Chart. Earlier I was expecting the rates to rise, but rates have just flattened since then. But then it struck me that the pattern that the Nifty is forming is strikingly similar to what the 10Y Yield has be forming. Also the pattern looked like a classical chart pattern Head and Shoulders. Now in the crash of 2008 in India bonds also crashed hard. I am expecting that the current rise in Nifty is of corrective nature, and at this point in time there is not evidence to suspect that we wont fall. 
Of course classical chart patterns fail often, and I am not an expert in their interpretation at all. But still I feel this information was worth sharing. Please refer the charts below for similar behaviors of Nifty and 10Y Bond.
10 Y GOI Bond Crash

Nifty 2008 Crash


Thursday, October 25, 2012

Crudeoil - Elliott Wave Update

Crude Weekly
Crude Weekly Indicators
EW Perspective
Crudeoil broke below all important B-D trend line.  If our count is correct, we should see sharp falls in Crudeoil in near future, since we have completed a terminal pattern (triangle) in wave {Y} of (B).

Technical Indicators
RSI -  On the above chart shows a contracting formation, synonymous with a triangle. RSI has been oscillating about the zero level, with decreasing amplitude, if we see a convincing break below the B-D trend line, RSI may sport a zone shift from the bullish to bearish. 

ROC - ROC has formed a huge bearish divergence, chart attached below, with contracting formation towards the more recent price action. Since the completion of wave D, ROC has been listless, a break below the lower boundary on ROC chart will signal further fall in prices.

MACD - MACD tells the same story, contracting action around the zero line. If MACD starts moving below the zero line and sustaining then we are sure to see bigger falls in crude.

Sunday, October 21, 2012

Nifty, Sensex - Elliott Wave Update

Nifty Daily

Sensex Daily
Both Nifty and Sensex above have been consolidating near the lower boundary of the consolidation, not good for longs. We may see prices continuing the down move once the lower boundary is broken.

Saturday, October 20, 2012

USDINR - Elliott Wave Update

USDINR Hourly
USDINR broke out of a consolidation and gave a big move (notwithstanding my earlier post). And this move should continue for a while. Another consolidation seems to be emerging with lower boundary at 53.60. We may see another move up soon.
RSI as can be seen has remained above 40 for most part of this up move and consolidation. And if this move continues we should remain in the 60+ zone to see some accelerated moves, ahead (Thanks to @ranajayb for the RSI article, but whether my interpretation is correct or not, only time will tell). As soon as the longer EMA (Green Color) catches up with price, we should see another big move.

Thursday, October 18, 2012

USDINR, Nifty - Elliott Wave Update

USDINR Hourly
USDINR may be terminating this up move with a triangle. But that's just a speculation. The pattern will only get confirmation below 52.57 (S). RSI gave an advance break out, but prices need to breakout above 53.17 (S) and sustain. So naturally that becomes stop loss for any shorts that may be initiated on intraday rallies.
Nifty Hourly
Nifty rallied smartly taking support around 5640 levels. Prices may find resistance in the 5750 - 5780 range. Th markets are in a consolidation phase, so beware of false breakouts and breakdowns.

Saturday, October 13, 2012

USDINR, Nifty - Elliott Wave Update

USDINR Hourly
USDINR may have completed a 5 wave advance marked [1], now we should be looking for a 3 wave pullback, to confirm the up trend. Prices may have completed 2 of the 3 waves of the pullback. I feel prices may test 52.40-52.20 zone, before resuming the up trend. 
Nifty Hourly
Nifty is on the verge of completing an important 5 wave advance. The 5th wave may be forming a terminal triangle. The consolidation should continue for a while and then a break down would confirm a short to medium term end to this up move to begin with. A breakout on the other hand would warn of  serious flaw in this analysis. But this much information should be sufficient to manage risks properly.

Thursday, October 11, 2012

Nifty - Elliott Wave Update

Nifty Daily
Nifty got resisted in our resistance zone, now time for confirmation. Nifty should break 5535 odd levels within 10 days from today, to confirm an end to this medium term up move. We completed a 3 wave down move from late 2010 top, and now it seems we may have completed a complex double three. Once we break 5535 every 3 wave rally should be sold into, hopefully for a quite some time to come.

Saturday, October 06, 2012

Nifty "Freak Trade"!

Well the freak trade low does not concern me. But something else does. 
Suppose the institutional order was wrongly punched in "price" and not in order type i.e. "buy or sell" or "quantity". 
It means anyhow the "institutional client" was going to exit the markets with much more than 650 crores (since the trade amount is decided by the freak trade rates instead of prevailing market rates, which are almost double that of the freak trade rates). 
Now that gives serious let in on what the "big money" is doing in this raring bull run, "getting out". I think we should at least be alert to the possibility of markets staging a turnaround at these levels. For going short we need more confirmation, but it wont hurt to start booking some profits at these levels, or tighten your stop losses.
Reforms mean we messed up in the first place, or late to the party. I don't think there is much anyone can do in such times of underlying economic turmoil. I wouldn't bank on these announcements much more than finding good opportunities to liquidate my holdings.

Caveat: The ideas expressed above are my own, and I may be wrong about all of it. Please exercise your own judgement or take the opinion of experts (I certainly am not one, and don't want to be!). Also in trading matters please follow your own trading systems, use above information if you find it useful!

Friday, October 05, 2012

Crude, USDINR, Nifty - Elliott Wave Update

Crude Oil
Crude as cautioned earlier, seems to have broken down from the triangle. Of course the implications are quite bearish. This break down has turned crude into a sell on rise market.
USDINR
USDINR on the other hand is looking like it may be nearing a support. The weekly chart has little evidence to suggest for it. But on shorter time frames, we might have completed a corrective structure. It may be too early to say anything, but I wont be surprised if USDINR turns up from here.
Nifty
Nifty baring the freak trade of today, seems to have found resistance in the 5740 - 5870 range mentioned earlier. If our analysis is correct Nifty may have seen all it can on the upside for quite some time to come. The caveat of breakout above 5870 is still in place.