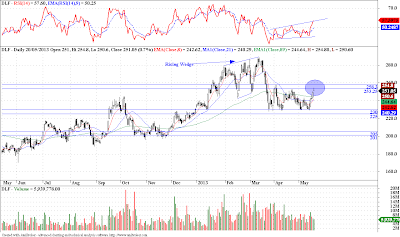
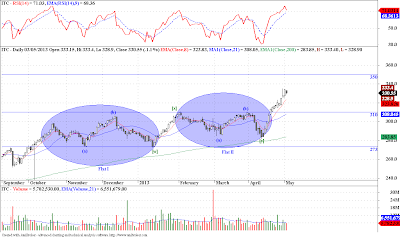
- Possible HnS marked on the chart.

- Possible HnS marked on the chart.

- Possible HnS marked on the chart.
This is not a post to tout another trading opportunity, but if you can squeeze one out of it, good for you. This is just an interesting observation, lets see how.
As with every trader, I have my ways of identifying possible supply and demand zones in the markets, and the above charts are examples of 3 markets which according to my analysis, MAY be at or near a supply zone. Now this is exactly what as a trader I am on the lookout for, a possible supply and demand zone, and a good clear CTA pattern with clear entry and invalidation objectives.
If this supply zone plays out, then these small HnS patterns could be the ones, which will prove to be the exact entry point in to the markets, of course if we trade above the top of the head, this pattern invalidates and so will be my supply zone. Then I will have to get back to the drawing board I guess.