 |
| 4 Hourly Chart |
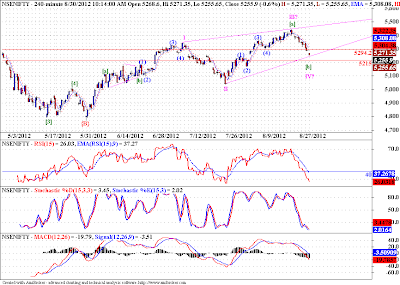
This count includes another possibility, in which we have already completed wave III of {C}. And right now falling in wave IV of {C}. The pattern is same, that of an ending diagonal, so far. We may rise from the support zone mentioned earlier between 5295-5215. And head towards 5630 levels. However one rule of EWP might come into play, if we start rising from here, and will be of great help. The rule is 3rd wave of a motive wave is never the shortest. In our case wave III is shorter that wave I, so to satisfy the EWP rule stated above, wave V cannot be longer than wave III. Once we establish wave IV low, we can ten pinpoint exact level, above which this wave V cannot go. If at all it goes above that level, we can expect even higher prices in Nifty. In the daily chart below, we can see if prices do turn from the support zone mentioned above, 5630 may be within the reach of possible wave V.
 |
| Daily Chart |
As always I am sharing an alternate scenario as well, shown in weekly chart below. In this scenario, if we do fall below the support zone, mentioned above. We have to be ready with a plausible scenario, and that scenario was highlighted earlier on this blog, that of a triangle in wave {B}. We may continue with prices consolidating in even narrower range. The breakout from this narrowing consolidation will clear the further trend in this market, my bet is up, still.
 |
| Weekly Chart |
Note: Some readers have a problem with my analysis. The argument is that the "discussion of multiple possibilities in a market tends to be confusing and does not add value". I would like to say, I am just discussing probabilities here, it may sound defensive to some, but its the truth. I have a trading method as everyone who is dabbling in market is expected to have. I use EWP to become aware of different probable scenarios in the markets, and then trade the one which gives me highest "expectation" using my trading method. Now as with many people around me, this concept may be a little hard to digest, or may be plain wrong, for the readers, but I cant help it. If I sound confusing, then may be I am, but it is preventing me from losing money in the market, I would take that bet any day!


Hi Aniruddha,
ReplyDeleteWave III looks 5 wave structure. So its is better to mark it as 'a' of 3 & currently Nifty is moving in 'b' of 3 after which 'c' will follow and might go abv 5630. There I would like to Mark III complete..
Thanks & Regards,
Harsh Dixit.
I agree, it does look like 5 wave structure. And I have given this count to be prepared, if market reverses suddenly. Since we are tracking an ending diagonal there is always the threat of sharp reversal of prices, and along with it reversals of fortune! Thanks for sharing your insight.
DeleteRegards
Aniruddha