 |
| Hourly Chart |
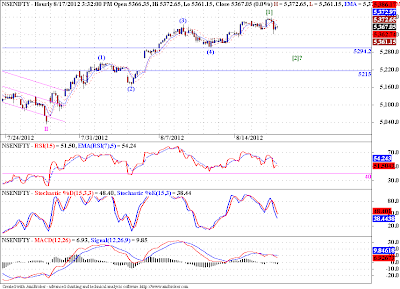
This is an hourly chart of Nifty. We can see a clear 5 wave move on Nifty. Earlier I had marked 1-2/1-2 wave structure, implying a sharp burst of prices upwards in wave (3) of [3] of III, please refer the chart here. Though that possibility is still possible, we have to be prepared for alternative outcomes. I have labelled the above chart as a possible wave [1] of III, which means we may slide down to form wave [2], towards the 5295-5215 levels. For the earlier scenario of a 1-2/1-2 to play out we should stay above 5350 levels. If we drift below 5350, this second possibility of wave [2] may come to fore.


No comments:
Post a Comment
...I am thrilled to learn what you think about this piece of content...