Tuesday, July 31, 2012

Banknifty, Nifty - Elliott Wave Analysis

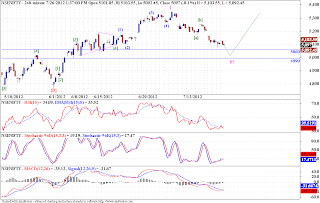
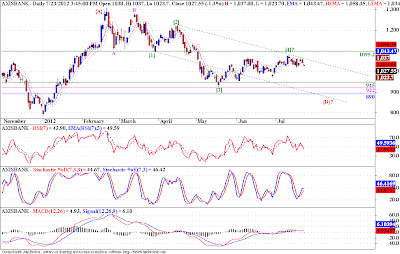
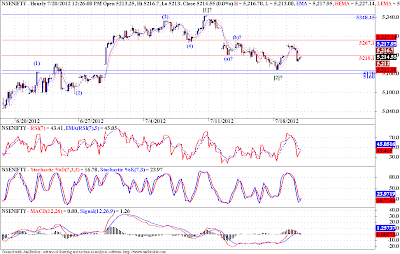
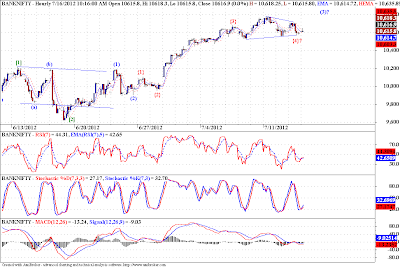
The chart above is a 4 hour chart for Banknifty, and looking at it this morning I could not help but notice a possibility of another leg down before we embark on the wave III. I looks like a zigzag correction, and may take prices to the range of 9900-9675. Also we cannot see any positive divergence on either RSI, STS or MACD. Same is the case with Nifty, again we may test the 5000-4900 range, before turning back up. But there are some critical resistances which if taken out may result in the up move continuing from current levels. The levels are 10710 on Banknifty and 5260 for Nifty. As long as we stay below these levels there is a chance of another leg down to the above mentioned ranges, on both Banknifty and Nifty.

Monday, July 30, 2012

Crudeoil - Elliott Wave Analysis

Daily Chart
The Dollar weakness may continue for a while, which may give us another leg up in Crudeoil / INR. Incorporating the modified wave count here.  Refer last post here.
Weekly Chart

Heromoto - Elliott Wave Analysis

This is a weekly chart of Heromoto, I am trying to label an ending diagonal pattern. There is a possibility of a last rally (dying gasp) in Nifty, and the same could translate in Heromoto as the last leg of the ED pattern. We know that ED patterns precede violent reversals in prices. Earlier I had posted a bullish view on Heromoto, but subsequent developments in prices have tilted my balance towards bearish possibilities. Once this ED completes we may see sharp reversal, and the complete potential for this correction ranges from 940-550. This count is on a very big fractal, so the price moves may take myriad ways to reach the targets, the prudent thing is to keep the big picture in mind, but follow the prices on smaller fractals.


Nifty - Elliott Wave Analysis

4 Hourly Chart
Nifty has reached our support zone, and has already showing signs of a possible reversal. Will this up move continue, only time will tell. But if we want to reap the benefit of this possible up move, we must concentrate on some critical levels, first is the 5 DHEMA @  5155, second is the 5 WEMA @ 5172, closing above these levels will mean the momentum will be with the bulls, but the key resistance is around 5260 odd levels, the wave [b] top. If we take out this level, we can become more confident of the up move. And finally the top of wave I @ 5342. Remember we are expecting a wave III, so as we go on breaking above these levels there should be marked increase in the momentum, if we falter at any of these resistances, we should be alert to the possibility of this up move failing, which may result is sharp downside movements. The hourly chart below provides us with another priceless EWP nugget, along with the resistance levels mentioned above, we should also be on the lookout for prices breaking out of the rising blue channel, since corrective waves tend to be contained within parallel lines, if we break out above this chanel, we may see sharp rise in prices, significant of third waves. Getting resisted at the top channel boundary of course will mean the move was corrective, and the main trend is still down.

Hourly Chart

Saturday, July 28, 2012

Nifty - Elliott Wave Analysis

Monthly Chart
Note: The three lines marking the three scenarios are for illustration purpose only. These lines do not depict the time frame for these moves. The actual time taken will be what markets want, and cannot be predicted with much certainty.
Please refer to my last post on Nifty long term Elliott Wave Count. I only showed my preferred count on that chart, which is not the complete picture always. So I have added other possibilities on this new chart. I have this much price history only for Nifty. But that does not stop us from arriving at an informed opinion about Nifty's whereabouts in the larger trend. 
I have marked the labels to be focused on by red ovals, just concentrate on them for the moment. There are three possible options, we will go through them one by one.

1) Wave Structure - [I]-[II]-[III]-[IV] is developing.
     In this case we will correct moderately (only when you compare it with other two alternatives) to the price range of 4200-2950. Preferably closer to the lower band of this range. That is the best possible case, and we should take it with both hands.

2) Wave Structure - [III]?-[IV]?-[V]? is done.
     In this case we have completed a 5 wave move on a very large fractal (roman letters in square brackets), and the correction to that 5 wave move should reach the area of the previous wave [IV]? and it comes in the range of 1375-800. That's scary to the bone! Now we can begin to appreciate the modesty of the correction in option (1).

3) Wave Structure - [A]?-[B]?-[C]? is done.
     Now this case is here purely from an academic point of view (at least that is what I am trying to tell myself), because if this scenario plays out, we are in for a complete washout of what ever progress you can see on this chart (left bottom to right top) and some more. It is difficult to envisoin what all things, social and economical, will have to happen (go terribly wrong) before we reach the possible target in this case.

But even the first 2 scenarios are very severe, and I cannot see any reason why we won't play out the scenario (2) instead of (1). But whatever happens we can always follow the markets using wave principle, at least we can avoid being on the wrong side of a major market move. If any of these wave counts play out, not being on the wrong side of market in itself will be able to ensure your survival!

Friday, July 27, 2012

Crudeoil - Elliott Wave Analysis


Monthly Chart

 This is a monthly chart of Crudeoil/INR, I have tried to mark an already known pattern on it. The pattern is of a zigzag. The EWP guideline of channeling suggests that often corrections are contained by two parallel lines, by virtue of this guideline we can anticipate how Crudeoil may perform in coming days. This scenario matches well with the rising dollar scenario, which will cause the commodities to fall, but the only hitch is as dollar appreciates and Crudeoil falls, so will the INR. How far this fall in INR helps the cause of Crudeoil in India, I cannot tell. But if we forget all this economic jabber, and just concentrate on the patterns, we can see that, if the envisioned zigzag pattern is correct, and the top in wave (B) is already in place, we are in for a severe correction in oil prices in India.
Weekly Chart
The weekly chart above shows that the wave (B) was a double zigzag, and the last leg of this {W}-{X}-{Y} correction, is over. We have already traded below the wave [4] of C of {Y} of (B) in wave I. Also what has followed it is a clear 3 wave corrective move, as shown in the daily chart below. But is this 3 wave move the complete correction, or a part of a flat correction, remains to be seen. The depth of this correction is already 61.8% of the wave I, so either the correction is over or we may have a flat wave II. In any case I feel Crudeoil/INR may be very close to a resistance zone, between 5145-5180. We should see prices easing down from here, if this expected fall accelerates downward, we may well be in wave III of {I} of (C).
Daily Chart

Wipro - Elliott Wave Analysis

Monthly
This is the monthly chart for Wipro, I am doing this on a request. As discussed previously in the post on Infy, i am looking at big correction in Wipro as well. The monthly chart marks possible target area for this correction, which is way down from current levels, and the lowest point lies at the 2008 low. So if Prechter is correct about the deflationary depression in US, and the US dollar rising to much higher levels, resulting in severe bear market in US equities and almost every other equity market round the globe, our market will fall in line as well. And scrips like Infy, Wipro, SBI, etc will be the leaders of the mayhem.
The chart below is a weekly chart for Wipro, and much like the Infy chart, provides two possible wave structures, either, and series of zigzags or a simple flat correction, with wave (C) in progress, which should be nothing short of devastating, in coming months. I have already said the situation is scary in Infy, and this analysis only adds to the fright!!
Weekly

USDINR - Elliott Wave Analysis

4 hourly
We have been tracking the corrective wave (b) for some time now. It seems to be over. The last leg wave {c} of (b), topped around 56.41. The reason I am saying this is, the USDINR pair has come down, and taken out the top of wave 1 of {c} at 55.45. We know if it is a wave 4 it cannot go below the top of wave 1, and as it has happened, we can say that, this corrective pattern may be over, the least the prices can do now is to reach the low of wave {b} around 54.85 levels. If we break below this level too, then the correction will be deemed complete, and we will test even lower levels in wave (c) of [4]. Please refer the count on longer fractal on the daily chart below. I am looking for a bounce in 3 waves so that I can position myself for the most dynamic part of any impulse, the 3rd wave, wave {3} of (c) in this case.
Daily

Nifty - Elliott Wave Analysis

4 Hourly
Nifty corrected sharply in last half hour of trading yesterday. I have still not bothered to find out what was the publicized reason for that fall. Since I don't follow news or any other financial media for that matter, I am usually happily oblivious to such events. But that surely does not mean that I am not prepared. Look at yesterday's post, especially at the Nifty chart. I had already marked a probable support zone, which might provide support to this recent fall in prices. Prices have gapped up sharply, as if yesterday's "event" means nothing, if at all there was an event, I gladly will never know. Prices have rejected the price range we had marked yesterday, now what we need to make any profitable trades, is prices to sustain above that zone, and start moving up in the earnest. The hourly chart shows positive divergences on both STS and MACD, The 4 hourly chart is showing positive divergence on STS, also RSI has turned sharply from extremely oversold region, The daily chart shows MACD Signal line poised to form a Zero Line Reversal (ZLR), and a small positive divergence on STS.
Now Nifty needs to close above certain critical levels, to confirm this reversal. The first and foremost is 5 DEMA at 5112.50, second is 5 WLEMA at 5145, and third is 5 DHEMA at 5155. Once Nifty manages to close above these levels, we may see prices going to higher levels from here.
Watch out for out currency update on USDINR to get further clues about the market.

Thursday, July 26, 2012

Nifty, Banknifty - Elliott Wave Analysis

Nifty 4 Hourly
Banknifty 4 Hourly
This is a 4 hour chart of Nifty, since the hourly and daily time frame, was getting confusing, I tried to hit the golden mean, and found some interesting things on the 4 hour chart of both Nifty and Banknifty. Nifty as I said in my last post had formed only 3 waves from the low of 4770, but on the 4 hour chart we can see a 5 wave pattern, though not totally convincing, but satisfactory to some extent. The Banknifty chart , also can be counted as a 5 wave move, with greater clarity than Nifty. In both these charts, and corresponding 5 wave moves, we can spot extensions in 5th waves. And hence the correction following the completion of the impulse move in wave I is going so deep. On Nifty we might test 5060-4990 range and for Banknifty we may test the 9900-9700 range. What is interesting is to take a look at the wave {A} of this corrective move on a larger fractal, given below. We can see that the first wave {A} of this 3 wave corrective move, was a straight advance, very sharp, on both the indices. So by the guideline of alternation, we can expect a more clearly subdivided move in wave {C}. And that is what is happening here, I feel.
Nifty Weekly
Banknifty Weekly


Infy - Elliott Wave Analysis

Weekly Chart
This is the weekly chart of Infy. As we had outlined in a couple of preceding posts on Infy (Post I / Post II), the prices are expected to touch the 2025 mark before any meaningful bounce occurs. But both the previous posts, were sans any wave labels. I just wanted to show that once the "Elliott Touch" acquires you, you don't need wave labels all the time, to make some accurate and profitable forecasts. So what I have done now is added some wave labels to the Infy chart, and the picture that is emerging is scary to say the least. The weekly chart above suggests that we have completed a clear 5 wave advance (on a very large fractal) at 3499 on 7 Jan 2011. Since then we are correcting steadily. Te best possible label that I could put on the chart was that of a developng DZZ (Double Zigzag). We have already completed the wave (W), already risen in wave (X) and are now forming wave {A} of (Y). This wave {A}, as mentioned already in the previous post is expected to bottom around the 2025 levels, and prices are steaduly charting their course towards that level. Once wave {A} is done we can expect some bounce in wave {B}. So far so good. By now you must have also observed the alternate labels of (A)?-(B)?-(C)? possibility. This is what is scary about this situation. Now if we are in the wave (C)? of this correction, we may just be in the worst part of the decline, and this 2025 level might provide little or no support at all, and we might continue the current free fall for some time to come.
The daily chart below paints a dreadful possibility, if observed carefully, both the consolidations marked by ovals, show a similar overall structure, which means the guideline of alternation has not been followed very clearly here, which means, we might be in a 1-2/1-2 formation, and we all know the outcome of such a pattern. Some preliminary studies suggest a possible target of 1200 - 900 on Infy. But I would warn you against taking this forecast too seriously, as it is on a very long term fractal. Right now in the short term, and on the foreseeable and trade able future I am looking at the 2025  level, to get some idea of the future course of this scrip.
Daily Chart
Note: Other IT scrips listed on Indian Stock Exchanges, should fare the same fate.

Wednesday, July 25, 2012

Nifty - Elliott Wave Analysis

Hourly Chart
As shown in the daily chart below I am able to count the rise from the lows of 4770.45 as a 3 wave move. The detailed wave structure is presented in the hourly chart above. According to it we are forming a 1-2/1-2 structure, and presently correcting the second wave [1]? in the 1-2/1-2 structure with wave [2]?. The question marks suggests that it is my alternate count for now, the reason being the inordinate depth of wave [2], though we have not yet violated any of the EWP rules, so till the time prices remain above 5042.50 the up move is possible, below it we get a confirmation that the rise was indeed a corrective 3 wave rally, and we should see much lower prices in coming days. If we cross below the 5075-5042.50 band, we are almost sure to see the 5000-4900 band, where I am expecting the prices should find some support, if my triangle pattern plays out. Else we will need to break below the low of proposed low of wave A to negate or at least postpone the possibility of the triangle.
Daily Chart

USDINR - Elliott Wave Analysis

Hourly Chart
USDINR was expected to form a corrective pattern, in wave (b), and it has progressed beautifully so far. We thought that the pattern was completed at the 55.93 level on 12th July, but it was actually a part of a flat correction in wave {b} of (b). Now it is also possible that we may start a new up move in wave (5) as a part of our alternate count.  But I always go for the most conservative count, and use trailing stop losses to remain in the trend, as long as it continues. So we have th equality target, i.e. wave {c}=={a} at 56.60. Also fibo retracements of the preceding wave (a) comes in the range of 56.12=56.60. So as we were expecting the prices to trade in this range since a long time now, it has actually happened. The most important thing to do now is to track the internal wave patterns of this wave {c}, which has to be an impulse, and try to find the exact levels for this impulse to terminate. Because what will follow this corrective up move is an impulsive down move in wave (c). Wave (c) being the third wave it is often very severe, hence a good opportunity.
Below I have attached a daily chart, which shows my preferred and alternate counts. Also it shows the possible target area for wave (c) in roughly 54-53 range.
I will be tracking the patterns closely, and will alert when a trading opportunity presents itself.
Daily Chart

Tuesday, July 24, 2012

Bharti - Elliott Wave Analysis

Daily Chart
Long back I spoke of a triangle in wave (IV), refer the post here. I was looking for a 290 levels on Bharti. The low of 280 on 24/5/12, if held we may see Bharti embarking on an sustained up move. In EWP terminology it is called as thrust from a triangle. But whether broad market supports this view, is a question I cannot answer at this moment. Bur Prechter in his epic book EWP: A key to market behavior, has mentioned, that one should not ignore EWP patterns in individual stocks. 
Also on the indicator from, we can see MACD meandering around the 0 level. One can also spot a big positive divergence on MACD. The last up move, though it looks like a leading diagonal, is surely an impulse move, so now even if we are not embarking on wave (V) on a very large fractal, the alternate count also suggests an up move from 290 levels, in wave (c) of [b], following which we may see a decline in prices. So I feel it wont be such a bad idea to grab some of this scrip around 290 levels, with a stop below 280, nice reward to risk ratio too.
Weekly chart has been attached below for reference. Do send in your vies and comments on this post.
Weekly Chart

Banknifty, Axisbank - Elliott Wave Analysis

Axis Bank
I was bearish on Axisbank to begin with. Looking at the Banknifty chart, we can see a series of 1-2/1-2 waves. The target area for latest wave (2), comes around 10200-10060 range. But below that we may look for a deeper correction towards 9675, still keeping the bullish count intact, but just. So if we take out the 10200-10060 range on Banknifty, we should see one more low on Axisbank.
If Axisbank takes out the 1095.20 level, we may see a healthy up move. But if it continues to slide down, we will test the 920-890 range, also the lower channel boundary.
Banknifty

Monday, July 23, 2012

Nifty - Elliott Wave Analysis

Nifty broke the 5160 levels today, and quite convincingly too. Thanks to EWP, I had already marked the possible alternate scenario. Thus keeping us ready for any untoward market action, such as that of today. Now my alternate count suggests we may fall from these levels, and shall reach the 5000-4900 range. I have marked a possible triangle in wave {B}. So we are out of longs, and should look for a good short entry point if one needs to try his hand at such short term moves. The risk reward is not to my liking, but for the short term the trend may be down and may head towards the 5000-4900 range.

Friday, July 20, 2012

Nifty, USDINR - Elliott Wave Analysis

Nifty
Nifty is sharply down today, if we agree that there is some correlation between Nifty and USDINR, then a sharp decline in USDINR should result in a rise in equities. Now the short term wave count suggests that Dollar may weaken further and in response, equities should rise, that has been my underlying story for a while. Now if this scenario plays out we will see much higher prices, at least we should reach 5630, that's a minimum requirement. The recent price action fits well into a channel, and a break down from this channel, will confirm the 3rd wave down in USDINR.
USDINR

Thursday, July 19, 2012

Banknifty - Elliott Wave Analysis

Hourly
Banknifty has turned up from the very range of previous wave {4}of 10525. That's no miracle, but a result of an astute observation by a legend (R. N. Elliott), under his very own EWP. The 4th waves tend to bottom around the terminal points of previous 4th wave of one lower degree. Both RSI and STS have turned up on daily fractal. I feel we have just completed the wave (4)? and are now on our way to compete wave (5) of [3]. The up trend in this index is very much on, and we are likely to see much higher prices in coming days.
Daily

Nifty - Elliott Wave Analysis

Hourly
Nifty gapped up today, and is comfortably trading above the 5225-30 range, we mentioned in our last post. Now the next hurdle, or shall we say the next confirmation of an up move will come above, 5260-70 range, as already envisioned in our last post. Now shall the Nifty take out these levels, we will see further upsides from these levels. The weekly STS and RSI should turn up. MACD on weekly time frame, is pushing the 0 level, if it manages to cross above that, it will mean that prices are gathering momentum on the up side, which should help our cause. On the hourly chart above, we can already see MACD crossing above the 0 level, it should now sustain above it, for continued trend on the hourly time frame. On the daily chart, the picture is most encouraging for our medium term strength in the prices. I suggest once again to keep the SL at the 5170-60 band, and wait, sit tight unless the markets come down decisively and topple you (a.k.a hit your stop loss). A wise trader Jesse Livermore has said "Its the SITTING that makes you the money!", I say, "EWP prevents us from being DUCKS!"
Daily

Wednesday, July 18, 2012

Nify - Elliott Wave Analysis

Hourly
Nifty got supported around 5170 levels, or so it seems for now. We cant tell if Nifty will turn up from here. On daily chart attached below, we can see RSI and STS turning up, that's the positive side. But one look at the weekly chart and we can see the same indicators turning down from overbought levels. Now giving such conflicting signals is very common for these indicators, and especially in such situations, we cant trust any of then on any time frames. This is where EWP with its patterns come for rescue. I wont say that you can always be on the right side of the market with EWP, but at certain point in time, you can always tell for sure, that you may not be on the right side, and its time to take evasive action.
Now I suggest we wait and watch if the market crosses above the wave (b) top at at 5270 odd levels, and in the short term close above the 5 DEMA at 5225- 30 levels. These early signals will tell us whether markets have any intention to scale up from here. The risk is very small at 5160 it is 50-60 odd points on Nifty, as a positional trader I would take that bet any day, since the possible reward with the minimum target for wave {c}, at 5630 comes around 400 odd points. For those who are long from even lower levels, I suggest to hold on there longs, with SL in the 5170-60 range. But Nifty must close over 5225-30 levels for starters, and must take out 5270 levels soon.
Daily

USDINR - Elliott Wave Analysis

Hourly
The hourly chart of USDINR shows, we may have completed the wave (b) of [4] 55.93 levels, and have since came down. This scenario was envisioned in our last post, though we expected the rise to continue in the 56.10-56.60 range, we turned down below that level, this goes to show once again, that, markets will do what they have to, its us who should adjust accordingly. In the process we got resisted at the center line of the corrective channel to complete wave (b) and then have broken down from the corrective channel. I have labeled a tentative {1}-{2}/1-2 labels on the chart, and look forward to a deeper slide continuing till the 54-53 zone in wave [4]. I believe one last dash up is remaining in USDINR, before we see a bigger correction. But for that we have to respect the pink channel, that I have drawn on the daily chart below. This channel is where I expect wave [4] to end, but below this channel, I believe, the correction could get deeper. Fibonacci retracement levels and channels combined together, can give you surprisingly high probability reversal areas, from then onwards though, its just a game of chance.
Daily

Tuesday, July 17, 2012

Nifty - Elliott Wave Analysis

This is the long term chart for Nifty,  I am not explaining the wave counts, as they are self explanatory. I would appreciate your feedback and opinions after seeing this chart.

Nifty - Elliott Wave Analysis

This is the daily chart of Nifty. I have marked a near term bearish and bullish count on it. In bullish scenario, I am counting the I-II/[1]-[2] waves only, but altered the count a bit. So we may see 5160 levels, before we embark on the [3] of III up. STS has also reached oversold levels. The bearish view suggests a possible triangle in wave {B} and after completion of this triangle, we may see prices rising in wave {C}. The count on shorter time frame will need some more price action for clarity. I will update as soon as market tips its hand, I am still favoring the bullish count, but whatever we think markets should confirm it, no point fighting the markets, its more rewarding to follow it, so for the time being I am keeping SL at 5170 - 5160 band, and will watch the markets from there. Also if we break out above 5342, the up move in wave {C} will get confirmed.

Monday, July 16, 2012

Cipla - Elliott Wave Analysis

Weekly Chart
This is the chart of Cipla, at first the charts and trend lines look overwhelming, but a more patient observation would reveal interesting possibilities. We are rising after completing a 3 wave down move at the label marked (W). Now the (X)? wave might have completed already around 360 levels, and then we fell in wave {A}? down and presently rising in wave {B}? in 3 waves, in red channel. After completion of this wave {B}? around 340 levels, we may start down on wave {C}? of (Y). This is my alternate count.
The preferred count suggests that we are following the pink channel, and we are currently rising in wave III of {C} of (X), which may complete around 380 levels. The path is marked in pink lines. Both the counts suggest that we have to test the 270 - 250 band, either after getting resisted at 340, or if we take out the 340 level, then after getting resisted at 380. 
My personal bet is that we may get resisted at 380 and then fall. But its always better to follow the market, that predict them.
On the daily chart below, we are following the blue channel, if we break out from the blue channel, we are sure to test the 380 levels. On the contrary if we get resisted at top boundary of  blue channel around 340, we may play out the alternate scenario.
Daily Chart

Nifty - Elliott Wave Analysis

Banknifty
The Banknifty chart above shows a possible triangle formation, according to it, we may have left at least one more dash to the upside, commonly known as "thrust from the triangle". On the other hand Nifty may be forming an irregular flat marked by labels {1}? - {2}?, which is my alternate count, but looking at the Banknifty chart looks more likely. I talked about the support zone around 5250 - 5220, which is still in contention. But prices need to reverse up soon to keep that count alive. Another count, my preferred one, suggests that we are in a sharp wave (4), but as per EWP rules, we cannot go below the top of wave (1), at 5170. So far as that level is protected, we can move up. On Banknifty chart though the trend is clearer, and the 5 wave sequence is not yet complete, so the best ploy is to wait and watch, keep stop losses in place.
One thing the readers might note that, you can use two correlated markets to get a better grip on the wave counts, like in this case, Nifty is not very clear, but Banknifty might help us discern the wave structure.
Nifty

Friday, July 13, 2012

Banknifty - Elliott Wave Analysis

Banknifty is showing a clear impulse pattern, the wave III has been subdividing for a while now. The buy on dips stand has paid off so far. The target for wave  {C} of (B) ideally comes in the range of 12460 - 11950. The mnimum target would be the wave {A} high at 11230. 
One thing I would like to clarify on the hourly chart above, is that, there can be seen big negative divergences on the hourly chart, but [rices seem to disregard it completely, and there is a valid reason for that. The reason is when a trend on a higher fractal in is force, the divergences on lower time fractals do no necessarily have the expected effect. Till such time as the higher fractals near the completion of their respective patterns all the divergence would mean is a pause, not an end to the up move.
The daily chart shows wave {C} of (B) in progress, the wave III of {C} is subdividing on ever smaller fractals, that is the "selfsame nature" as Benoit Mandelbrot put it, and Elliott pointed out way earlier. So right now I expect the up move to continue for a while, at least till 11230 is reached.