


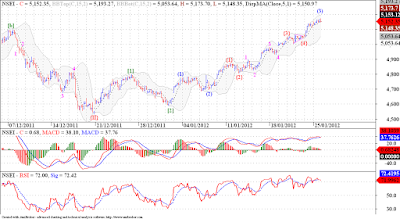
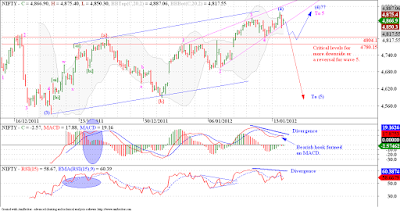
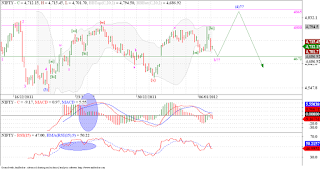
Nifty staged a magnificent rally today. I was warned by one of the well wishers about an irregular correction in Nifty ending at 5070 levels. And truly market has snapped back from those exact levels. But since wave [2] was a zigzag, and deep, we should get a flattish wave [4], if indeed wave [3] is done. And since yesterday we have one 3 wave downmove followed by a 3 wave upmove today, akin to a developing flat or a triangle. Today's rally if continues tomorrow, will turn into a new impulse wave, but if we are forming a flat or a triangle in wave [4] we should move down from current levels, either in 5 waves in case of a flat or 3 waves in case of a triangle. So tomorrows price action holds the clue for Nifty in near term. I am for a downmove from current levels, but nobody's above the markets!


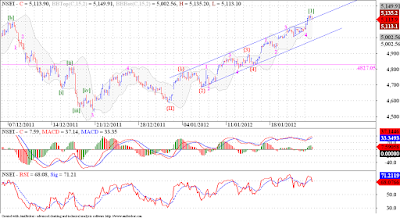
![Nifty wave [4] underway !](https://blogger.googleusercontent.com/img/b/R29vZ2xl/AVvXsEgcWUlmtQivU4_nZzEDpVXT_eP93FyiynHVQjHPWGnDkSp75Nw5gc7d9fWfuPwfv7DagHCAdtSgy-fqPqaIMkZmEaar3QrLnI9zfIdMXLjN9QS9ZoMVWtaMM2mNjhxj4S92t_EsGBhD2Rov/s400/30-1-12+Nifty+H.png)


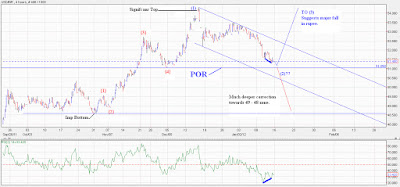


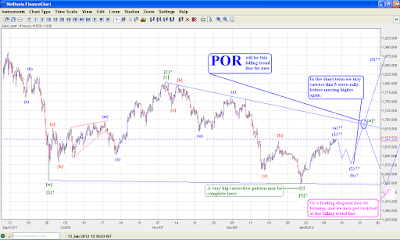


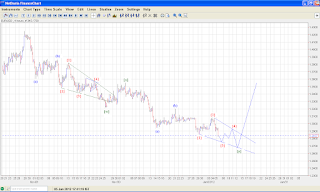


![Natural Gas falling in possible Ending Diagonal in wave [c]!](https://blogger.googleusercontent.com/img/b/R29vZ2xl/AVvXsEiwecZktCuM8D3Py2VWbONvffxxvH44JIl0ce6fHT6Gw7HxvmdJCmLuE3XhlrFruaGhcSjkn4fgRKI8x6W1aaf6xUVKcqftoblkqBaDZ6W2Krv3kf-l-C-DUTWfpaQ7Y7yeMdAFNPgX2DdY/s320/5-1-12+Natural+Gas+W.png)


