Friday, June 29, 2012

USDINR - Elliott Wave Analysis

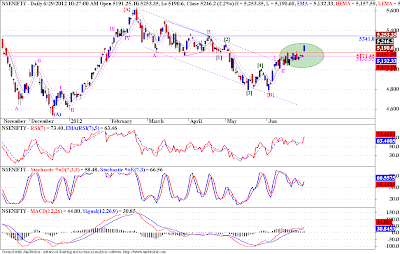
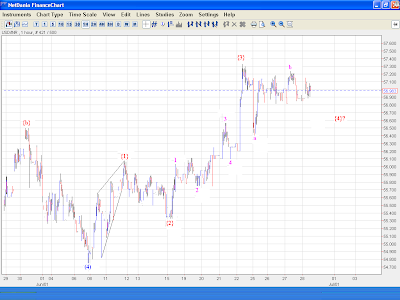
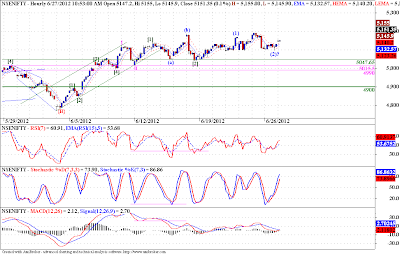
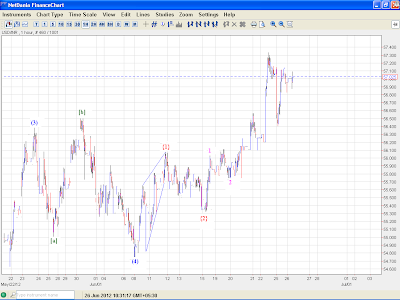
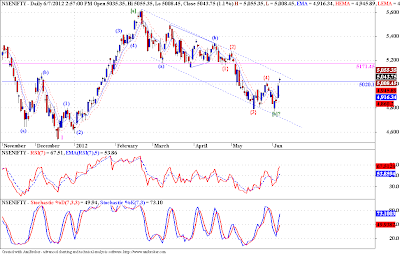
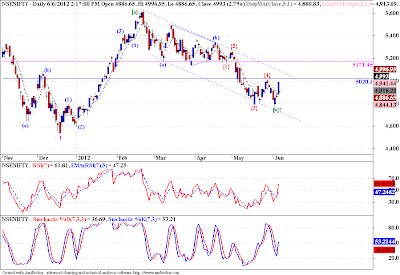
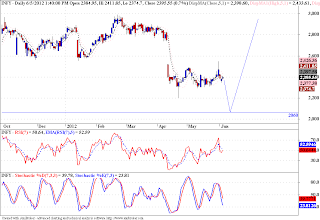
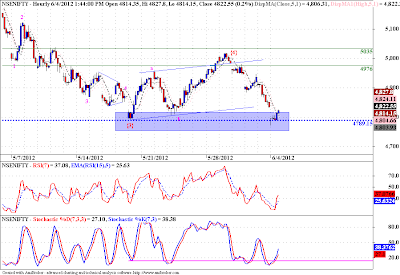
In our last post we were expecting a pause to this sharp rise in Dollar against the Rupee. On the lower fractals our wave count fell short of what we were expecting. So today's rise in INR suggests the onset of wave [4]. This consolidation has given the fillip to the Nifty, as expected. Now the possible range for this wave [4] comes in the range of 55.30 to 54.00 range. So good for equities and INR, and a pause for Dollar in coming days. This is a unique feature of EWP, even if you are caught off guard you can put the market action in perspective, and be ready for the next leg of market movement.

Nifty - Elliott Wave Analysis

EWP is about pattern recognition, and picking up small small signs which helps us in identifying the strength of the market trends. We have been stressing the importance of the levels 5135 - 5172 as important resistances to a sustained up move on the medium to short term in our previous posts. And looking at today's break out, we can see no price action below 5172, whereas yesterdays whole price range was below 5172. I feel that's a good break out, and the fat that it has occurred when we were expecting the wave III to start, gives it additional zing!
So now it seems we are on our way to wave II and one would now require all the will power to whether out the minor pullbacks till the full potential of this wave III is achieved. Its a happy circumstance, EWP tells us when to show courage and sit tight, and when to grab our money and run!

Banknifty - Elliott Wave Analysis

Breakout! We have got it finally. We have been labeling I - II / [1] - [2] / (1) - (2) in our previous posts, and hopefully we are now on to the dynamic third wave. This should take prices much higher from current levels, and since we are expecting a third wave, intraday trades can buy the intraday dips (3 wave contra trend moves) to enter longs. I personally would avoid any type of shorts when we are in third wave up. On the daily chart attached below, the momentum indicators are showing possible acceleration in the price movement, above 10385 prices should really accelerate. But as in life the best way to live longer is protect yourself amply before taking any risks, so STOPLOSS must be in place!
We are getting a hook on MACD, support at 50 levels on both RSI and STS. We have a clear 3 wave move preceding our current rise form the 8995 levels. All this suggests that we have a nice up move on cards, and we should sit it out by properly managing the trade!

Thursday, June 28, 2012

Dollar Index - Elliott Wave Analysis

DI has so far traced out an Elliott Wave pattern of a double zigzag. I am giving a link to my last post on DI, one can observe how precise your forecast can be using EWP. We have taken the support in the range mentioned in our last post, and has moved up towards our target of 84. There are however alternate possibilities on the DI, this is just one of them we have discussed here. On the near term though, we are tracing out a clear 5 wave pattern in wave (c) of [y] of E of {B} (see last post for weekly chart). WE may continue this sideways move for a while and then rise to complete wave {5} or we may have completed the wave {4}, and are already rising in wave {5}. Using the guideline of alternation, since no new high was made in wave {2}, we can expect a new high in wave {4} or a triangle. So waiting for the correction to resolve is probably the best option right now. The wave counts on large fractals are quite bearish for the dollar, and it will take time to play out. The prudent thing to do, will be to take one wave at a time.

Nifty - Elliott Wave Analysis

Nifty has not done anything yet to dislodge our count, but we cannot bank on it. USDINR has more room on the upside, which may translate into a fall on Nifty. I reiterate once again that 4900 is the decider, till then we can expect the up move to resume any time. The patterns on momentum indicators mentioned in last post are still valid. Attaching the daily chart below.


USDINR - Elliott Wave Analysis

The consolidation in USDINR continues, there is a possibility of a triangle in wave {4}. In my last post we marked possibility of a the start of wave (5), but if this consolidation continues we may see a triangle or a flat in wave {4}. There is no sign of end to this up move as yet. We are on the prices to spot any change of mood. Keep your stop losses is place and let the prices take their course.

Wednesday, June 27, 2012

Nifty - Elliott Wave Analysis

Nifty continues to be in the rut, courtesy strong uptrend in USDINR. Unless it pauses for a while we are unlikely to breakout from current levels. Though the squiggles are giving a chance to label them in a satisfactory manner, nothing can be relied on unless we breakout from this consolidation. We are hoping for a third wave it might either be a wave (3) of [3] of III, or a wave C, but whatever it may be it has to be sharp and dynamic. Keep your stop loss in place and sit tight.

USDINR - Elliott Wave Analysis

This chart shows EW labels, marked till the very end of price structure. The last three labels are shown with a "?" behind them. It means that we are not yet sure whether these wave labels are final or not. We may get a complex wave {4} or it may be over already. What ever the case may be, we are still in the up move. And so long as this up move in USDINR continues (i.e. fall in the Rupee against the Dollar), we are unlikely to see Nifty taking off. But markets have their own strange way of catching the herds unawares, so don't rely too much on that correlation. The best way is to apply EWP, device a plan to trade and stick to it.

Crudeoil - Elliott Wave Analysis

Crudeoil is falling in clear impulsive pattern. We are currently in wave [3] of that impulse. There are a couple of steps still pending in this downturn. All the indicators are showing possible divergences, none of it is confirmed yet. On a larger fractal though we may just be falling in wave I. That paints a grim picture, and we may have a long long way to go. But that is still some distance from here, the strong dollar is causing the fall in commodities, and there is still some room in the very short term for the dollar to go up, before it halts for a while. I say wait till this down move is done, as meat of the move is past us, on short term. But any healthy bounce towards the 4900 - 5100 band should be sold into.

Tuesday, June 26, 2012

USDINR - Elliott Wave Analysis

We were expecting a sharp rise towards 58 levels to complete the wave (5) of [3] in our last post, and we have got just that. We have not yet scaled the 58 levels, also the internal structure is not conclusive of a completed 5 wave move. What we could clearly see is the trend is still up. But soon to be running into a resistance, we may see some sideways action in wave [4], before rising for one last time in wave V, for which the channeling guideline gives a target around 60 levels. The most we can take out from EWP is not to be on the wrong side of the markets, and that's possible with a sincere study of the EWP. And if you combine all the guidelines of the EWP with a mechanical trading system and momentum indicators, you have a potent combination of tools to tackle any kind of market.

Banknifty - Elliott Wave Analysis

Banknifty shows a clearer 5 wave pattern as compared to Nifty. I feel we have started on wave [3] of III. And presently we are correcting in wave (2) of [3] of III. STS and RSI has reached oversold levels. MACD is approaching zero level. We have got support around 9800 levels. But all this is true if our of count of wave [2] completing at 9625 is correct.
There is a possibility of a bigger correction towards 9625 levels forming a bigger flat correction in wave [2], we should be alert to that possibility if we decidedly break below 9800 levels. Adding the daily chart below for reference.
We have a big hidden divergence on STS. RSI is hovering around 50 levels. And similar to Nifty MACD is moving sideways above the zero levels, which suggests that, the possibility of an up move is still intact. But a close below 9545 should be crucial to this possible up move.

Nifty - Elliott Wave Analysis


Nifty is continuing its sideways move, albeit inching up slowly. I have tried to label the squiggles on the chart, but during such periods, patience is the virtue, as soon as you put a label on the chart, you subconsciously start to commit to that count, so its best to decide a break out and break down level and wait for them to be breached. If your are already long, you should just bring your SL just below 4980, and wait for the market to show its hand. Once again 4900 should e a crucial level to the fate of this up trend. Adding the daily chart below.
We can see clearly that so far the 50 level is holding on both RSI and STS. MACD is hovering just above the zero level. There is a possibility of a hook forming on the MACD (similar to "fast rise" set up on EMA). There is no signs of worry right now, but we should be alert before something shows up, as indicators always lag the markets.

Friday, June 22, 2012

Nifty - Elliott Wave Analysis

Nifty is not giving up any ground, though we are getting resisted at the higher boundary of the trading range, we are not breaking down either. We could say  that we are forming a flag like structure on the charts, with the preceding move expected to continue once this consolidation is over. That's classical technical analysis, on the other hand EWP is giving us much higher targets, if we go by the counts mentioned on the chart. The invalidation level of 4900 is of course crucial, and it will be critical what path the market takes to reach that level if at all we break the support zone in and around 5000. The weekly chart is offering an interesting picture, which I felt was worth sahring.
We have already fallen in a triple zigzag pattern in wave (A) of [IV], now we may rise in a zigzag pattern in wave (B) of [IV], with target area of 5800 - 6000, as per the channeling technique. On a bigger fractal, in wave [IV] we might be forming a flat, so once this 3 wave up move is done, we may fall in an impulsive manner in wave (C) of [IV]. But it is a far cry from here, we need to concentrate on the pattern at hand, and we will be tracking the pattern with the help of daily and hourly charts. This weekly chart showed the possibility of an interesting pattern developing, so I shared it.

Banknifty - Elliott Wave Analysis

Similar to Nifty, Banknifty is on the verge of starting a new up move. A series of 1-2/1-2 waves can be seen on the chart. RSI is taking support around 50 levels. STS is sporting a hidden positive divergence. MACD has stabilized above zero line. All this suggests that the current consolidation is merely a pause before the next leg up. The hourly chart below shows the count in greater detail.
Yesterday prices rallied in the later half of the day. The wave labels [1] and [2] mark a complete 8 wave move, and satisfies all the EWP requirements. But as we know corrective patterns are obvious only when they are done with. So though I believe we may have started the wave [3] of III, we need confirmation from prices, and that means no beating around the bushes, no consolidations, just sharp moves up from these levels.
As always if we break below 9620, this [3] of III count will come under scrutiny.

Wednesday, June 20, 2012

USDINR - Elliott Wave Analysis


This is a daily chart for USDINR. We saw the weekly chart in our last post on USDINR, we were in the last wave V of this up move. This daily chart studies the wave V internals in detail. We can spot a wave (IV) in progress, and we can see that there is more upside left still for the dollar. INR could touch the levels of 60 in this uptrend, if this particular set of wave count plays out. After that of course we can expect a pause in the dollars strong up trend. But once again, since I don't track the fundamental and news side of the markets, I am not sure how bad things could get with the global economy. If it continues to worsen, we might be in a subdividing third wave instead of the wave V. Or else we may see dollar getting resisted at levels around 60 on the INR and then ease back. This is my preferred count, and if anything were to happen to alter it, I would discuss the same in this blog. Right now, the downhill move of INR seems to continue, or should we say the strength of the dollar should continue for a while.

Tuesday, June 19, 2012

Nifty - Elliott Wave Analysis


Prices have been meandering between 5000 - 5150. The price movements can be labelled in many ways, just a couple of them are shown here. There are a host of support levels between the range of 5050 - 4990. So far as we reverse back up and hold above the lower boundary of this support zone, we are good for a dynamic wave III. Even if we break down from this range, the last hope is 4900, but below this level, I would be skeptical of this expected up move. The STS is oversold, RSI is sporting a positive divergence, MACD may stage a ZLR, but all this is based on the notion that we are going up, its always better to wait for the market to tip its hand and then jump on the train. I suggest waiting for those who are already in at lower levels, and for fresh positions, one can buy in this zone of 5050 - 4990, with 4900 as a SL for positional traders, and 4990 - 80 for short term market timers.

Friday, June 15, 2012

Axisbank - Elliott Wave Analysis


This is a link to our previous update on Axis Bank Last Update. There is an alternate possibility, which is shown in the chart above.

IDFC - Elliott Wave Analysis


IDFC is behaving on similar lines with Banknifty, and that's understandable. But IDFC is providing with a unique opportunity of a possible parabolic rise, in the most dynamic wave [3] of III of {C}. We have already crossed over two very important levels of 125.90 - 129.50. So we can work from the premise that the correction in wave {B} is over. MACD, RSI, STS are all in positive territory. MACD is about to form a second hook, which is mostly precedes an explosive move. RSI may take support at 50 levels. We need to close above the 131 5 DEMA levels to confirm a bullish bias for the prices. The {A} wave was almost a straight line move, and we can already see prices pausing and giving wave {C} a clear 1-2/1-2 look. We can see many things are falling in place, and we can take a long position with SL below 123.50. We may target 145 - 155 - 180 levels, if the wave {C} envisaged on Nifty and Banknifty takes place.

Nifty - Elliott Wave Analysis

Banknifty Hourly

Banknifty flat correction looks complete, we may start the [3] of III of C from these levels. But a look at the Nifty chart and the picture is not clear yet.

Nifty Hourly

The proposed wave [c] of II has not gone below the end of wave [a], so are we going to get a drop below wave [a] end, or are we going to turn up from these levels only, making it a running correction remains to be seen, I personally would prefer it to be a running correction, as it suggests exceptional strength for the next move, and we are expecting a wave III after this correction, so this might just be one of those opportunities where you have a potentially less risk against huge reward.

But how exactly to take benefit of this situation, we I suggest we buy on a break out above 5110 level and put a stop below the latest minor low, which if market does not make a new low should be 5045 levels. But remember never buy too soon and never wait too long. 5097 is the 5 HEMA, a close above this level today or tomorrow will confirm the wave III.

Just a caveat we have not yet broken the 5155 level the low of wave [1] of C of {B}as shown in the chart below, so technically / theoretically it could still be the wave [4] with target for wave (c) of [4] at 5144, so we could even fall from these levels if this alternate scenario plays out.

Nifty Daily

So all in all we have a big resistance cluster in the 5100 - 5155 zone above which we have clear skies and flying high would be the order of the day. But getting resisted at these levels, at least we will get heavy rains in the markets (Its hot in Nagpur - Rain Gods "Smile Please").

Thursday, June 14, 2012

Nifty - Elliott Wave Analysis


OK now Nifty is acting as we thought it should, and the moment of truth is near too. The price band of 5110 - 4990 is still there on the chart, it is where we expect our wave [c] of  II to end. After that we should move up, since my trading time frame is daily - weekly, I don't trade the hourly fluctuations, even if they are very sure. Now we may see a zero level reversal on MACD, which is a copy book pattern development. Prices have already closed below 5 DEMA, now we will wait for it to reach our target zone on the downside and then again close above 5 DEMA to initiate a long trade. This might turn our to be a very good long trade, if someone got in on the positive divergence on waves [3] and [5], they should hold their longs with SL at cost.

Wednesday, June 13, 2012

Nifty - Elliott Wave Analysis


The [a] - [b] - [c] flat correction in wave II is still in contention. If prices trade above 5172 this flat count will be negated. Prices have closed below the 5 HEMA on hourly fractal, which might suggest weakness on very short term. If prices continue to show weakness tomorrow morning, we may get the wave [c]. The dynamic wave III may start from 5015 - 4990 range, it was the resistance earlier, where we got the wave [4] top, now it has already provided support to prices two times, we might get the "third time lucky" charm, and start the wave III from these levels.

LT - Elliott Wave Analysis


Most of the stocks are tracing out patterns similar to Nifty, or Nifty is reflecting the patterns traced out by most stocks (to put it aptly). So LT seems to have completed an A-B-C correction and is now climbing up in wave {C}. Right now the whole debate is about the wave II of {C} on Nifty, and what pattern will it form. But whatever it will be, we are in a medium term uptrend, and so the stocks are going up. LT could touch the levels of 1670, and depending on the markets may even touch 2000 mark. But right now we might be in the early stages of a medium term up move, so the best strategy would be to buy on dips (depending on your preferred time fractal). Stay in the trend till it shows clear signs of reversal.

@Shrikant nice to see you after a long time.

Tuesday, June 12, 2012

Nifty - Elliott Wave Analysis


I have tried to put the market action in perspective, with a couple of possible wave counts. My preferred count suggests that we have completed the wave II at 5015, and now are on our way to the wave III. Any pullbacks here onwards should be bought into, and there is a good chance that they will show as intraday pullbacks on hourly chart, and wont reflect at all on weekly charts or daily charts. But my alternate count suggests that we might have wave [c] of II still pending, and may retest the 5015 - 4990 band once again before embarking on the dynamic third wave. If our alternate scenario plays out, we will get a good entry point in the range mentioned above. But yesterday's pullback satisfies all the necessary requirement of a second wave. If we gap up tomorrow, any intraday pullback should be bought into, to take the benefit of the dynamic wave III.

Axis Bank - Elliott Wave Analysis


Axis Bank has seen a rise recently from the lows of 922 levels, which for all practical purposes looks corrective in nature. What it means is we may see another bout of selling in this stock to complete the wave [5] of C of {B} in the 945 to 890 range. Its a wide range, but if we count the waves on the lower fractal correctly we can get a pretty good idea as to where we can see the end to this wave [5]. And just to be alert to alternate possibilities, if we break out above the 1095 level, this wave [5] scenario gets negated and we will have to relabel the waves. Then we will have to say that the wave {B} has ended in the 945 - 922 range, and we are of to wave {C}. One can place himself on the short side, with a SL above yesterday's high of 1072, and a SAR above 1095.20.

Monday, June 11, 2012

Nifty - Elliott Wave Analysis


A clear cut 5 wave move can be seen on the chart, and prices have crossed above wave [4]. Now prices should see a corrective move, and probable range for prices should test the 4950 - 4900 range. We have broken down the channel, we can see a negative divergence on RSI and STS, on waves 3 and 5. All this suggests that prices should rest for a while, and so should we. Wait for a "recognizable" Elliott Wave Pattern to complete, and then place yourself on the long side. However if prices trade below 4850 this upward count will be in question!

Saturday, June 09, 2012

Nifty - Elliott Wave Analysis


Here is a monthly chart of Nifty. I have labelled it. It shows that we might be in wave [IV] on a very large degree. But in the above set of wave labels the 4th wave have been sharp and deep. So far we have not made any serious dent in the price rise achieved in wave [III]. Prices are in consolidation, also MACD is hovering around the zero level. 
Prices are behaving with some strength and we have already closed above 5 WEMA, which suggests a possible trend change on weekly time frame. But looking at the above wave structure (if correct) we are supposed to correct towards the 2950 levels. 
Please share your views, it will only add to our knowledge.

Thursday, June 07, 2012

Nifty - Elliott Wave Analysis!


The rise from the 4770 levels is certainly not corrective so far, we have risen handsomely with minimum retracements and overlaps, this is the behavior of impulse waves. Now we need to close above 4950, which the 5 WEMA, it will signal positive bias on weekly chart, and will confirm the reversal on daily chart. We can look at 3 wave pullbacks for entering in this uptrend. Look at lower time frames like hourly chart for entering on a pullback. 
Best of Luck!

Wednesday, June 06, 2012

Nifty - Elliott Wave Analysis


Nifty staged a sharp rally, which almost confirmed today. Now two overhead resistances can be seen to confirm a sustained up move. The two counts above are bearish and bullish respectively, but as it often happens using EWP both suggest an up move in coming days. It could either be a third wave or a wave [c], and both are going to be dynamic. But as always this is what we make of the markets, what exactly will happen depends totally on market itself. If prices sustain above 5020 we may look at any consolidation as an opportunity to buy. But don't rush the markets, if up move gets confirmed we will get many 3 wave pullbacks to enter into the trend.

Tuesday, June 05, 2012

Nifty - Elliott Wave Analysis


Once again momentum indicators gave us warning about what to expect from prices. No clear positive divergence on hourly chart yet, prices getting resisted at the 5 DEMA, STS on hourly chart reaching overbought zone and turning down, and a hidden negative divergence on both STS and RSI, all this suggested that we may retest the recent bottom once again, or if at all the down move is over in the short term, we may get deep retracement of yesterday's rally. I feel prices may retest the lows once again, also the internal wave structure is not clear enough to give us confidence, so in such cases, keep your stop losses in place and wait for the pattern to complete, and if stopped out or booked out, look for bounces such as yesterday to enter again on the short side, till a clear positive divergence emerges on the hourly chart first.
Have patience!

Infy, Tatasteel, Tatapower - Elliott Wave Analysis

Infy
Tata Power

Tata Steel

These are three charts on daily scale, I have marked possible price action on the chart, but no labels. You can use the possible price action to generate probable wave counts. You may share your counts with everybody, through this blog, or just use it for future reference, as to how market played out. You can email your charts to aniruddha2907@gmail.com if you want to share it with everybody, I will publish it on my blog.

Monday, June 04, 2012

Nifty - Elliott Wave Analysis


Prices have actually turned down from the exact price band we discussed prior to prices even reaching that price zone. Though Elliott Wave Theory is a potent tool that gives such moments of pin point accuracy, we might as well have gotten lucky! That said, we can see that prices have actually dipped below the low made by wave {3} in this hourly chart, that is the minimum requirement for any wave {5}, but looking at the sub waves of this wave {5}, we cannot say convincingly that this wave {5} is done, a good positive divergence is developing on daily chart, but we might test the 4700 levels before we turn up for a meaningful rise. So as we got vigilant at the resistance zone a few days back, we should be on our toes as prices approach the 4700 zone. If we let prices tip their hand first, who knows we might get lucky again.

Friday, June 01, 2012

Nifty - Elliott Wave Analysis


Nifty may not have completed the triple zigzag correction. The labelling shown on the chart shows that we might be in wave [c] of Z of {II}. The area of previous wave IV of {I} is highlighted on the chart above. We are already near the lower level of that range. The daily chart below shows detailed count for the last leg of this correction.


We may be in wave (5) of [c] of Z of {II}, once this wave (5) is done we may embark on the much awaited upmove in wave {III}. The possible range for this wave (5) comes in the range of 4700 - 4560. This wave is a good trading opportunity in itself. But one has to be on their toes once we reach 4700 levels. After that we are in hot territory for a reversal pattern. So once 4700 is reached partial profit bookig is in order. STS has turned down from overbought levels, we may see prices accelerating on the downside.


The recent 3 wave rise has proved corrective, and what follows a corrective move is an impulse move. So we may be falling in an impulse move and prices are expected to reach the 4700 - 4560 zone. At this stage what we can do is to just count the waves down and look for waning momentum on the downside.

This may be the period where the investors who are suffering from a long drawn frsutration since 2008 and especially severe since the market top in 2010, may be about to end, in coming days. But we cannot preempt the reversal just yet, we will need much confirmation for a reversal, and the good news is we will get ample time to get in after confirming the end to this corrective pattern and beginning of the new up move.

This is a bold attempt, use this as a frame of reference to help you keep the price action in proper perspective. As I have repeatedly stated to trade you have to have a mechanical system and filter its signals using a bigger frame of reference.