Wednesday, May 30, 2012

Nifty - Elliott Wave Anaysis


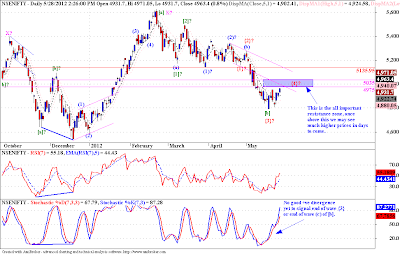
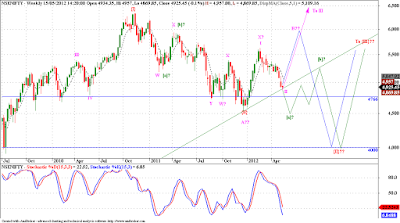
Nifty is finding it difficult to cross over the 4975 - 5035 zone. Also prices is getting resisted at the falling channel. Now alternate count of an impulsive downmove suggests that we should now fall down in wave {5}?, prices may take different paths though. We have seen prices resisting at the 5 WEMA, and have fallen down towards the 5DEMA around 4950 levels. If we manage to close below this level on EOD basis, we may indeed start to fall again, and we can enter on the short side with stop and reverse above 5035 levels. But we cannot rush the prices, one should be patient to let the prices close below 4950, to initiate a short position.

Tuesday, May 29, 2012

ITC - Elliott Wave Analysis


ITC has seen a consolidation phase after a steep rise in wave [3], as shown on the chart. This whole rise is taking place in the form of a breakout from a triangle. Now the wave [4] may unfold in a couple of ways, either it is a triangle similar to the one in the wave IV of higher degree, or a simple a-b-c with wave b as a triangle, and wave (c) targets in the range of 223.85 - 221. Since wave [2] was short and sweet, wave [4] was going to be complex and time consuming. Keep an eye on the larger market to catch the tradable wave [5] in ITC.

Monday, May 28, 2012

Nifty - Elliott Wave Analysis


Nifty has risen upto the resistance zone of 4975 - 5035. Everything will depend upon how prices behave at this level. If we break above it the bullish scenario comes into play, and we may see good price rise from current levels. But if we get resisted at this zone then, then we may see much lower prices. There is one more resistance to prices the lowe channel boundary, shown in pink lines, so we are at an important junction point, interesting time ahead.

Friday, May 25, 2012

Nifty - Elliott Wave Analysis


This is hourly chart of Nifty, we can see a clear non-overlaping move is unfolding, we may have completed waves {1} and {3}, and now looking to consolidate in wave {4}. Since wave {2} was sharp, we may get a sideways wave {4}. What makes us say that this 5 wave move is not yet over, is the absence of a good positive divergence on the daily chart to suggest an end to the wave {3}? (refer daily chart below), due to many degrees playing out at the same time, we see duplication of wave labels at different degrees, but during such periods you have to bear with it.


I suggest we may have one more dash towards the lows made a few days back. Then we may get the much needed positive divergence to call an end to wave {3}?, or (c) of [b], whatever the case may be. It can ony be confirmed by the price action that follows, once the requisite waves are in place.

Thursday, May 24, 2012

USDINR - Elliott Wave Update


The channeling technique applied to the price movement of USDINR reveals that there is a possible resistance zone in the 57 - 58 range on USDINR. The larger channel marked {A} - {B} - {C}, is expected to confirm at the top channel boundary. This resistance comes in the range of 57 - 58 Rupees to a Dollar. But if this zone is taken out then we may see much lower levels on the Rupee. The rise in dollar causes the commodity prices to reduce, but the fall in Rupee against the Dollar is not letting us take the benefit of this fall in prices.

Tuesday, May 22, 2012

Nifty - Elliott Wave Analysis


There are three levels marked on the chart. Two of them marked in pink ( 4975 - 5035 ) should be the likely reversal zone, if Nifty is to follow one of our bearish counts. And if Nifty has completed the short term corrective pattern which started from the high of 5630, then we should take these levels out for a sustained upmove. The one in Red at 5136 should confirm that we are atleast going to have an extended pause to this downmove, and possibly a short term up move on cards. The first target for such an upmove would be 5630 and after that atleast upto 5895 - 5950 levels. We closed slightly above the 5 DEMA on 18 th May, and today we are trading above 5 DEMA. If this behaviour is sustained and we start to close above the 5 HEMA then we should look for 3 wave pullbacks to enter into this uptrend.

Friday, May 18, 2012

Nifty - Elliott Wave Analysis

Bearish View

In this post I am discussing both bullish and bearish long term counts for Nifty. Above chart is bearish. We are forming a flat correction, and may be completed a wave I (leading diagonal), followed by an irregular correction. Now may be we are starting the dreaded wave III down. The fun part is the normal / minimum target for wave III comes around 2900. Again I am in the mode, where I tend to give extreme bullish and bearish targets, this is purely from an academic perspective. I am a trader, and these long term views only serve as a backdrop to my short term trading actions. Please use your own judgement while using this analysis for making Investment decisions. Now that we have talked about the bearish view, lets take a look at the bullish view.
Bullish View
Here is a bullish chart for long term, we may drop till 4000 levels, still. Or may rise from these levels, itself. In this scenario we are forming a wave {II} of wave (V). So we have big big gains ahead of us, if we indeed take this path and eventually start the wave {III} of (V). 
I don't tend to confuse my view point with fundamental data, and conforming with other theories. There are many people who do a better job of it. I feel we have two possibilities, and eventually the price action itself will clear what path the market will take. Please refer the short term updates for trading action. And please share your views if you have supporting or opposing arguments to my market view. Also if you have any theories or information to share, please feel free to share it on my blog.

USD INR - Elliott Wave Analysis


A couple of channels are playing out. Channels are vital tool in EWP. They help you put the price action within a framework. Now two channels seen on the chart can suggest impending resistances to prices. the ADX indicator is showing an interesting development, the trend is weakening, STS is at overbought levels. So going by what we see on the chart, we can expect prices to run into resistances soon. But this is what we see, and prices don't know nothing about channels, indicators, these are for us to put price action n perspective. So prices can do whatever it wants to do. Now it remains to be seen how prices play out. This will have a great effect on equities as well. Interesting times ahead.

Nifty - Elliott Wave Analysis


Nifty is falling consistently. It is perilously close to our last hope for a bullish reversal, and things don't look too good. In the meanwhile the short trade we took around 2nd May, is making us richer by the day. The stops are intact, One should not look to close out the position unless prices close above the 5 DEMA. Now a close below the 4766 level opens up a new bearish count, which has a potential to take prices much much lower from current levels. Considering we are already short, and the trade has moved handsomely in our favor, we can afford to wait and watch. Contra trend trades are very enticing, but unless there are clear signs of reversal "abstinence" is what will keep us in the game. Momentum indicators are poor performers in case of persistent trends, so don't fall prey to their signals, just yet. Just ride the wave down till the last drop of juice is out. Those who have missed an entry in the downtrend, the risk reward ratio will become worse by the day, I suggest wait for a clear 3 wave bounce to short, down trends are spaced with sharp recoveries, so just when one such recovery is resisted at important levels, you can enter, but with very tight stop losses, Its always better to "die another day"!!

Tuesday, May 15, 2012

Nifty - Elliott Wave Analysis


Nifty has still not formed a satisfactory divergence on daily chart. We have divergences on hourly chart, but that might just be suggesting an end to the wave (3). We may have a small rise and fall sequence to complete the wave [c], as shown in the chart above. But if we start trading comfortably above 5040 in five waves, then we might just be through with the wave [c] of  II. Next couple of days will be crucial.

Nifty - Elliott Wave Analysis


This is  a weekly chart of Nifty. We can see a host of possibilities marked on it. And we cant be very sure about any one of them at this moment. But we will go through all of them one by one,

Case I
Nifty is very near to the end of correction in wave II. From these levels of 4880, we may see a dynamic rally in wave III. That is the count which we have been following as our preferred count, a caveat: even though this is my preferred count, it does not mean it is preferred by the market, so I have my fail-safe's in place and so should you. The action required in this case is pretty simple, just wait for a small 5 wave rally from these levels, wait for a small 3 wave pullback to that rally, and enter on completion of that small 3 wave pullback, also make sure we rise above the end of previous wave (4), to confirm an end to this down move. I will update important short term levels as we move along.

Case II
Here we are contemplating a double zigzag, the notations for this count are followed by single "?" mark after the wave labels. Here we may continue the fall for some more time to complete the wave [a], in the process we will break down from a long term trend line (that will add to bearishness), then rise to get resisted at the same trend line from below, and fall again, to complete the W - X - Y formation in wave {II}, around 4000 levels on Nifty. Early warning for this might come, when we break below 4766.

Case III
In this case we may form an A - B - C correction (wave labels followed by "??" mark), a simple zigzag, but wave A as a leading diagonal. In this case we may rise from current levels to a high of around 5950 - 6000 range to complete wave B, and again fall back in 5 waves to complete the wave C of {II}. This possibility may trap many bulls once it crosses above the 5630 level, which by many is considered the break out level for a new bull move. It may indeed prove to be true, anyways if we were to embark on wave III, we will have to breakout above 5630. But if prices get resisted around 5950 - 6000 range, we better be careful. As it may come back all the wave to 400 levels, and that too in a dynamic wave C. The wave {3} of C will be especially severe.

Friday, May 11, 2012

Nifty - Elliott Wave Analysis

Hourly chart
Nifty is falling is a persistent trend, quite similar to what [c] waves are. We are forming a small positive divergence on hourly TA, but that could give a small corrective bounce only, as the wave count suggests that there is one more wave still pending to this down move. So we may pause here for a while, and fall once again to complete a satisfactory 5 wave decline. The level of 4880 is an important one, as it marks the [c] == [a] level, so another addition to the cluster of supports, now ranging from 4950 - 4880. 
On daily chart too, we have not formed any positive divergences yet, which are typical to price reversals. So as we rise and fall once again, we might get that divergence on daily chart.
If we are subdividing in wave (3) then there might be considerable room on the down side, also the pattern we are counting on larger time frame will also require modification. So either we are close to a bottom or right in the middle of a big decline, sounds two faced, but thats what market gives you, probabilities!!!
What we can do though, is watch how market performs at these critical levels, look for signs of reversals, trail our stop losses, and let the market decide which way to go. Following the market as best as we can, is the only thing which will keep us in the game long enough and help us be on the winning side eventually.
Daily Chart

Wednesday, May 09, 2012

ITC - Elliott Wave Analysis


Well ITC has risen from a big wave IV triangle. I have tried to put a label on the chart, and I feel we have completed an "expanded flat" in wave [4]. Now I might be wrong in my labeling and we may come down once more to complete wave (c) of wave [4]. Or we may continue up in wave [5]. FMCG stocks usually perform well when markets are in consolidations and lag when they are trending. So I feel Nifty is close to its bottom of wave II around 4950 - 4920 levels. I f we reverse from this range, and start on wave III, we have smart gains to see on Nifty, and at that time what ITC will do will be interesting to see. A good strategy will be to wait for a pullback to today's rise, try to determine whether it is a 3 wave or a 5 wave move, and keep a tab on Nifty. If Nifty takes support at this level, and ITC consolidates in a 3 wave move, we can expect more upsides in the stock. But If Nifty breaks below 4950 - 4920 band, we will have to take another look at it.

Nifty - Elliott Wave Analysis


I am not suggesting a bottom yet. The trend is down and strong. So to preempt a reversal could be risky. But we have been proposing a target zone of 4950 - 4920 for Nifty on the downside. Its better to wait and watch, and keep an eye for a reversal pattern in this range, first sign will be a close above 5 DEMA. Also look for a positive divergence on STS and prices.

Tuesday, May 08, 2012

Nifty - Elliott Wave Analysis


Nifty has completed  small 3 wave pullback after a small impulsive upmove. If this wave II is complete, then this small impulsive up move might be the start of a prolonged new up move. Now we have got a small pull back in 3 waves, to the 5 wave move. This is the ideal place to put on a trade. ADX has dropped below 30 on hourly chart. So we can take a small buy position here, and see how the prices go about. 5015 should be the stop loss.

Monday, May 07, 2012

USD INR - Elliott Wave Analysis


USDINR has shown strength which is correspondingly reflected as a weakness in equity markets. We are in wave V of {B} as per our preferred count, and upon completion of which we should get a sharp cut, atleast towards 49 - 48 levels to begin with. Alternatively, if we are in the wave {III}, which is our alternate count, then this price pattern is suggesting a subdividing wave III of {III}, that would be very bullish, and will take USDINR much higher from current levels. A global scenario of "deflationary depression" (as Prechter puts it) will cause this mega rise, but as we know that though deflation of the credit is overdue, the currencies are based on relative performance of economies, so I am still not sure as to where USDINR will go in long to medium term. As far as trading is concerned, we can try to spot the "opportunity periods" as shown in the lower part of the chart. That will really help us be on the right side of the markets.

Saturday, May 05, 2012

Nifty - Elliott Wave Analysis


We went through 5135, like a hot knife through butter. That is not good news, next support zone comes around 5030 - 4985. If this wave II is an [a] - [b] - [c], then we are currently in wave (3) of [c]. and if we are forming a [w] - [x] - [y] in wave II, then this wave (c) of [y], should find support around 5030 - 4985 band. Even if we do take support at this zone, but the bounce is not sharp and in 5 waves, we can be sure that we are going to test the 4950 - 4920 zone. So early birds just have to sit through this, and keep part booking at important levels. Remember we are approaching the end of wave II, at least by our preferred count. We can just wait and watch.

Friday, May 04, 2012

Hero Honda - Elliott Wave Analysis


The first three wave corrective move turned out to be wave A of the " flat correction",  we then completed a three wave advance in wave B, now we have started the fall in wave C of {II}. This could be a sharp fall as we can see from the start of it. The possible range for wave C is 1700 - 1575. Once we reach this zone we can look for possible reversal patterns. Till then it would be prudent to short every rise (albeit a 3 wave one).

Nifty - Elliott Wave Analysis


5161 gone on Nifty, now next critical support level in around 5135. Below 5135 we may see further fall towards 4950 levels. But give prices some room around this 5135 level. Look for corrective bounce to enter the down trend. Shorting on the break down of 5135 may get you caught in a "bear trap". This is not guaranteed but its better to be safe than sorry. 5135 is as important short term support level. On the technical side, ADX is in the 30 - 20 range on daily scale, so probability of a trending move is there. Those who shorted at 5280 levels, should trail there stops and keep part booking at important levels. Reinstate your partially booked positions on corrective (3 wave) bounces, in the opposite direction of the trend.

Thursday, May 03, 2012

Nifty - Elliott Wave Analysis


Nifty respected the resistance, and turned down. Stochastic indicator gave us an early warning about the impending reversal. Now what remains is the difficult part, "the sitting" part, which will make you rich. We are counting a [w] - [x] - [y] correction in wave II. but as we know that corrective waves are obvious only after they are over. So this [w] - [x] - [y] can easily become [a] - [b] - [c], but the correction should end once this last leg is over. and what gives us confidence to say that this downmove s the last leg, "the triangle" in wave [b] / [x]. Triangles precede the last leg of any move of "one higher degree". So once this down move is done, we should brace ourselves for a dynamic up move. But only time will tell what actually will happen!