 |
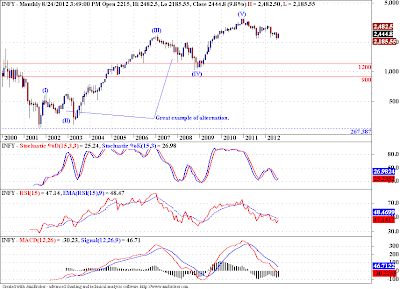
| Monthly Chart |
This is a monthly chart of Infy. One can easily spot a clear 5 wave move on it. If we consider this count as valid, then the correction to this up move should bring the prices back to the area of the previous wave (IV), preferably to the area around the terminus of the wave (IV). The probable range is marked between 1200-900, which may sound far fetched at this point in time, but it is what EWP tells us.
 |
| Weekly Chart |
So considering the possible pattern development in the monthly chart and its price implications, we cannot count the current three wave down move as complete. I believe that we are in wave {II} of (C) of this corrective pattern, and we have much more downside left in this stock. Also the most dynamic part of any down trend the wave {III} of (C) is yet to come. And that is what will separate the men from the boys. The wave A of {B}? has been very strong so far, and that may not be completely out of the line. But I feel it is still a part of a corrective pattern.
 |
| Daily Chart |
The daily chart shows a clear 5 wave decline, and since it looks complete, we were right in expecting a corrective rally. We get a good fibo cluster between 2550-2650 range.
But being an EWP practitioner, and seriously influenced by thought process proposed by Sir Karl Raimund Popper, I cannot take this analysis of mine too seriously, and should always be prepared for an alternative scenario. Since the minimum requirement of a zigzag correction has been satisfied, as seen in the weekly chart above, we may see as well see a start to a new up move from these levels. And hence my preferred trading action would be to buy any clear 3 wave counter trend move to this sharp rise, to play the wave C? of {B}? or if this alternate scenario plays out to play the 3rd wave.


No comments:
Post a Comment
...I am thrilled to learn what you think about this piece of content...