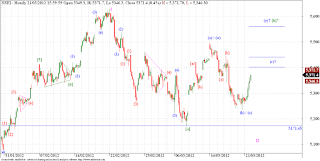
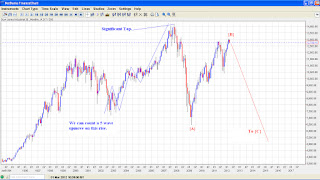
Thursday, March 22, 2012

Nifty - Elliott Wave Analysis.

Hourly EW Chart
Nifty tanked and how! Yesterdays rally created doubt in my mind, but with small adjustments we can resume with our original count. With 100% target of wave (1) - (3) for wave (5) we get a target around 5120. And by equality guideline for wave [c] = [a], we get the target levels around 5040. If we become very bearish, and start going below 5000 levels, we might be in for some very deep corrections.

Wednesday, March 21, 2012

Nifty - Elliott Wave Analysis.

Hourly EW Chart
Nifty moved sharply up today, and obviously put a spanner in our plans. But once again we can put this price action in perspective using EWP. Since the rise from 5170 levels was a 3 wave move, we can expect a DZZ or a Triangle correction now for wave [b]. If prices tomorrow cross above 5400 - 5440 band we are in for a DZZ correction and we may even see 5560 on Nifty. But if we get resisted in this band of 5400 - 5440 we may be forming a contracting triangle in wave [b], and should come down to form wave (d) of [b]. On a larger time frame I have marked wave I complete around 5630 levels, but some very good analysts still believe we are in wave [4] of  I, if that is the case we are already in wave (d) of [4] which may also be forming a contracting triangle, and prices should come down briefly to complete wave (e) of [4] before setting off on a wave [5] of I rally. Tomorrow's price action holds the key.

Tuesday, March 20, 2012

Nifty - Elliott Wave Analysis.

10 Min EW Chart
Nifty is falling impulsively. The internal waves are developing beautifully. Now wave (3) has a target range around 5180 - 5170, just around the lows of wave [a]. Now all we have to do during an impulse phase is "sit tight". So we will do that, till this impulse phase is over. I am reiterating once again, shorts should be lightened around 5170 levels.

Monday, March 19, 2012

Nifty - Elliott Wave Analysis.

Hourly EW Chart
Nifty did break the 5295 levels, which I had pointed out in my last post. Now the next support comes around 5225 - 5200 levels. Once through 5200 we will head for our final targets around 5080 - 5040 levels. Nifty's behavior should be watched at 5170 levels (bottom of wave [a] ), below this level we technically complete this correction. Shorts should be lightened below 5170.

Friday, March 16, 2012

ITC - Elliott Wave Analysis

ITC has been in a persistent uptrend, for quite some time now. Its really difficult to place wave markings on such charts, but looking at the price pattern developing for last year we can spot an ending diagonal. Now ED have some specific implications, one is that prices stage a sharp reversal once the pattern is complete. Now ITC rallied smartly today, and made a new high on a favorable Budget announcement. But today's spike may prove to be the last gasp before ITC tanks, and tanks big time. Now I may be proven very wrong, but thats the risk we have to take. For if we are right in picking this pattern then the reward will be well worth the risk. Let us see whats in store for us.

Nifty - Elliott Wave Analysis.

Hourly EW Chart
Nifty was volatile during the budget today, but once the session was done, and the dust settled, the market resumed its original trend, which was "down". Now how much more down side is remaining for Nifty, and by using the Equality guideline for waves [a] and [c] we get wave [c] target around 5080 - 5040 levels. This range also marks the 50% retracement target for the upmove which started from the 4530 levels. At a minimum we should make a new low below the low of wave [a]. But just to be cautious of any untoward development, we have to be on guard for a possible support around 5295 levels. Once through this level we will atleast test the bottom of wave [a].

Saturday, March 10, 2012

USD INR - Elliott Wave Analysis.

USD INR Daily EWP
Please refer my long term count on USD INR here. The current rally in USD INR clearly looks corrective. So an upward corrective move suggests that the main trend is still down, i.e. we may see firmer rupee in coming days, as envisaged in our long term view. We are expecting a sharp wave (C) down in USD INR, and so far we are doing pretty good with our count. This augurs well for our equity markets. As the rally in Rupee is about to resume, we should march upwards as well on Nifty.

Friday, March 09, 2012

Nifty - Elliott Wave Analysis.

10 min EWP
Nifty is showing multiple possibilities. If the TZZ was over at 5171.60 yesterday, then we are on our way to wave [3], only hitch might be an irregular flat correction in wave [2]. But my money is on the longs and we might already be on our way to wave [3]. The wave labels here are irrelevant, as if this the wave III, the there will be plenty of subdividing to come. There is a low probability possibility of the last leg of this TZZ correction still pending.

Wednesday, March 07, 2012

DOW Jones - Elliott Wave Analysis.

DOW Monthly EWP
DOW Weekly EWP
 Please refer my earlier post on DOW here. The long term DOW chart shown here suggests that the significant top which we thought was in place in 2000, can be shifted to 2008. Now, if that is the case, then we should be expecting a big zigzag correction following this proposed end of a large impulse move. Of the proposed zigzag correction we have already completed wave {A} down in 2008 - 2009. Since then we have had a stupendous rally, which to me looks like a bear rally, though in my last post I contemplated some bullish possibilities. On a lower time frame though the price development since last major low lends itself well to be counted as a DZZ corrective formation. Which might be in its last stages. It looks we might be forming an ending diagonal in wave [c] of Y of {B}. But that would be too early to say something like that. Al we can infer is that there exists a possibility of yet another high before we really plunge on the DOW, and likewise on S&P.


Nifty - Elliott Wave Analysis.

Hourly EWP
Nifty may be forming a TZZ correction, as labeled in the chart. Prices may have completed the TZZ correction or it may take some more downside before we complete this TZZ. One cannot be too sure about corrective formations but if our analysis if TZZ formation is correct, we must not be too far from a bottom. 5077.2 is a critical level for me, once this level is taken out, I may reconsider my analysis. On the upside though, if we cross 5381.7 we may well be on course the most dynamic wave III.

Monday, March 05, 2012

Nifty - Elliott Wave Analysis.

Hourly EWP
Nifty may dip to 5230 levels to complete the wave (c) of [y]. Currently we may be in wave {4} of (c) consolidation. Once this correction is done, we may see a sizable correction to this down move. Also we have broken down from the consolidation range on the downside, below 5297.75.

Friday, March 02, 2012

Nifty - Elliott Wave Analysis.

Hourly EW
Nifty is at cross roads, many experts are on bull side and many are propounding the bear side. I feel both the possibilities are equiprobable, and we will get a clear verdict only when we break either of two levels at 5392.25 on the upside and 5297.75 on the lower side.
Corresponding wave counts are given on the chart. My preferred count one without "?" mark after them is bearish and is looking for a DZZ correction in Nifty to 5200 - 5100 band. But the alternate count suggests either we have completed the correction and are on our way to wave III or may be an Irregular / Flat / Triangle correction is developing and will take Nifty to 5420 - 5515 range on the upside. Both depend upon on which side we break the range.