 |
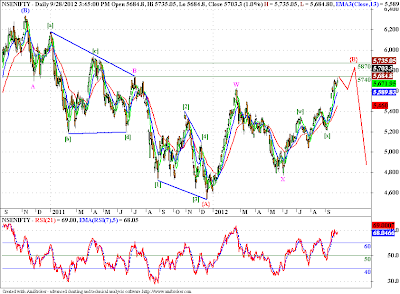
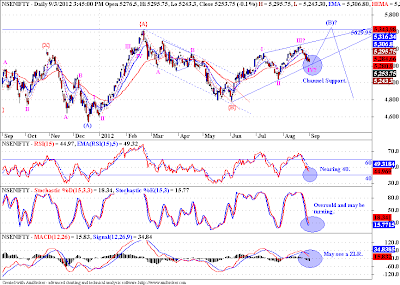
| Nifty Daily |
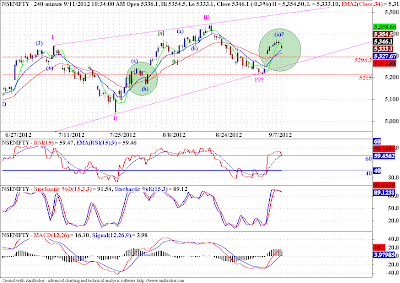
The area between 5740 - 5840 is critical for Nifty. If reversal occurs between this level, we may see sharp declines in Nifty in coming days. Above this level the upside may get stretched till 6300 odd levels.

|
| Nifty Daily |
 |
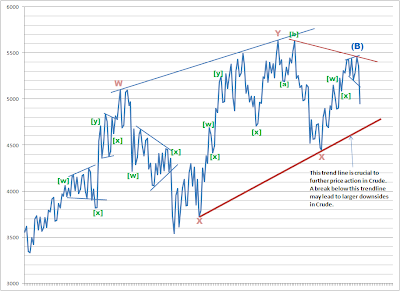
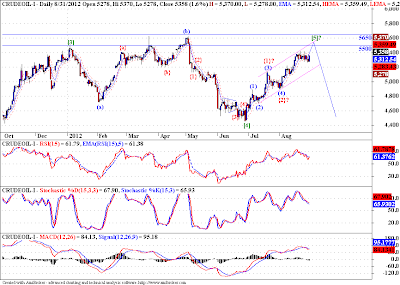
| Crudeoil |
 |
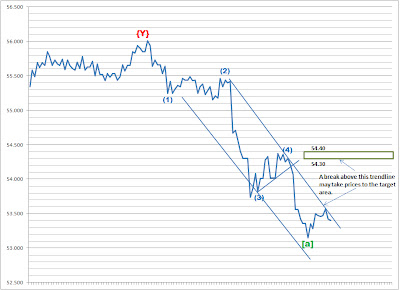
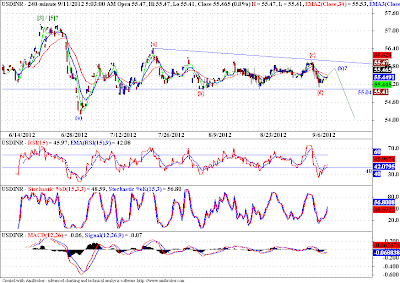
| USDINR |
 |
| Nifty |


 |
| 4 Hourly Chart |
 |
| 4 Hourly Chart |

 |
| Hourly Chart |
 |
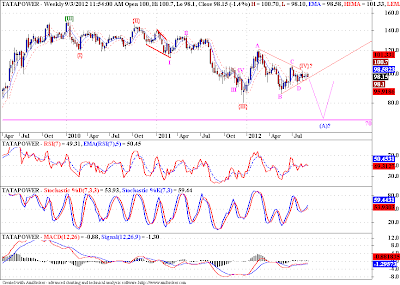
| Weekly Chart |

 |
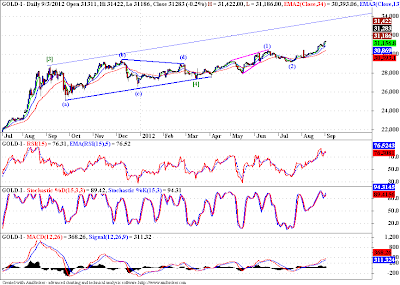
| Gold Daily Chart |
 |
| Silver Daily Chart |

 |
| Daily Chart |
 |
| 5 Hourly Chart |

 |
| Daily Chart |

 |
| Daily Chart |
 |
| Daily Chart |
 |
| 4 Hourly Chart |

 |
| Hourly Chart |
 |
| Hourly Chart |
 |
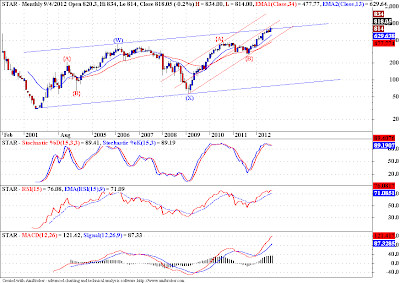
| Monthly Chart |
 |
| Weekly Chart |
 |
| Daily Chart |

 |
| Daily Chart |
 |
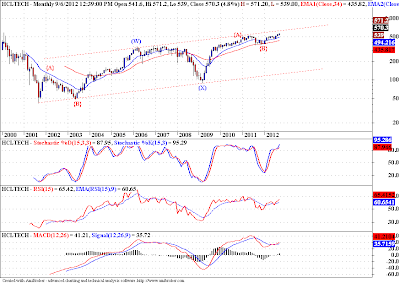
| Monthly Chart |
 |
| Weekly Chart |
 |
| Daily Chart |

 |
| Bharti Weekly Chart |


 |
| 4 Hourly Chart |


 |
| ICICI Bank Daily Chart |
 | |||
| Gold Daily Chart |
 |
| Silver Daily Chart |
 |
| Daily Chart |

 |
| Hourly Chart |
 |
| Weekly Chart |
 |
| Daily Chart |
 |
| Crude Oil Daily Chart |
 |
| Gold Daily Chart |


