
 |
| Hourly EW |
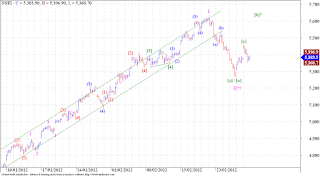
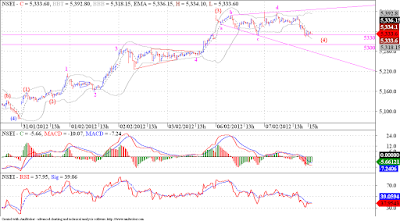
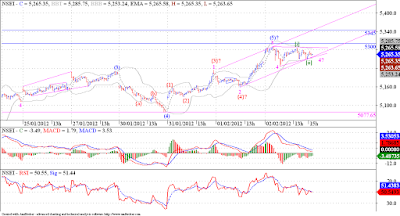
Nifty opened gap up today, but wore off through the day. This might give additional support to our DZZ argument. We may form the second leg of the DZZ and may target 5200 - 5100 area, to complete wave II. For this we have to stay below the high made today at 5458.60 and take out the low of 5268.35 as soon as possible.


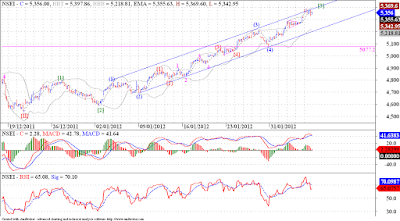


![Nifty rising in acceleration channel, wave [3] not yet done !](https://blogger.googleusercontent.com/img/b/R29vZ2xl/AVvXsEjLV6wBkDJ0AduUZFDsCyFFXNMGkRrlcVsuepZ2h3teX2pRdlyGSQqpIgFu3ErXMkDVZ0pced9OSuRJdh-M1DdyeAN3eOugIzl077BQwskJSoqzH5oRZBce86xP069UGtsD2veEKehd_-mw/s400/1-2-12+Nifty+10min.png)

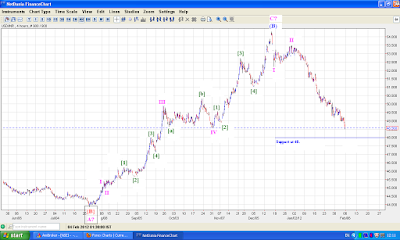
![Nifty may have completed twave [4], now on its way to wave [5] !](https://blogger.googleusercontent.com/img/b/R29vZ2xl/AVvXsEgLqROjaZh6f7ycax01e7lxFFwpXQSVj7wiKV9ZBFomX1DLolOOmk7gDntogyr9nB3HHc-0Qz_8jZYZk5IfAJ1SiMFHh9OlUe6mX2EbWFsy-2mxYUSP-47aUTw-Yh1NIT-NH-TNZZyyamen/s400/1-2-12+Nifty+10min.png)


