 |
| Weekly Chart |
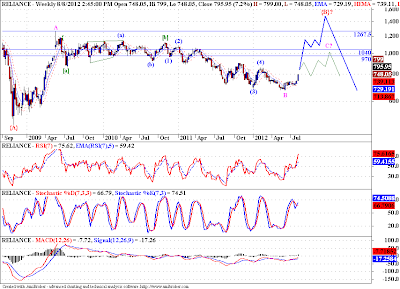
This is a weekly chart of Reliance. I have marked a couple of possibilities on it. One is quite bullish in near term, the other not so much. But in the long term both are bearish for sure.
The count marked in blue lines, shows an A-B-C move in wave {B}. If this count plays out, we may see Reliance rising over 1270 odd levels at a minimum, and may even touch 1475. But at this point in time it looks a bit too optimistic, but no one can argue with the market.
Second count marked in green lines, calls for a triangle in wave {B}, with wave B of {B} taking an inordinate amount of time. In this case, Reliance may find resistance in the 970-1040 range, and then come down in wave D of {B} wave triangle. So in the near term I feel Reliance may edge up, if it takes out the 970-1040 resistance band, and preferably the 1125 level, we may even see 1270-1475 range on Reliance.
Once again we are tracking the weekly fractal, so take your time before jumping in, referring the lower fractals for further cues could be a better idea.


No comments:
Post a Comment
...I am thrilled to learn what you think about this piece of content...