Saturday, October 05, 2013

USDINR - Elliott Wave Update

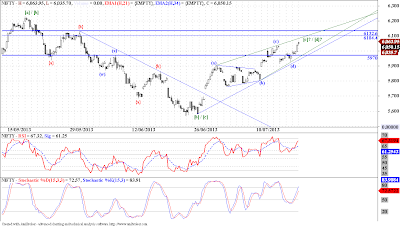
  1. This is a chart for USDINR spot. 
  2. I trying to count a possible pattern of double three in this 2 and 1/2 yr up move in USDINR from early 40s.
  3. The first leg was a 3 wave move, followed by an [X] wave.
  4. The price pattern after the [X] wave may be counted as a neutral triangle (Courtesy Neowave).
  5. Which means wave [C] should be the longest of wave [A], [C] and [E].
  6. The wave [B] was a drawn out affair in time, but price wise it did not make an impact, where as the possible wave [D] is sharp so far, and may reach 58.74 odd levels, before it is done with, providing us with clear alternation in price, time and the pattern formed or construction.
  7. Wave [E] should be short and sweet, and a sharp down move should follow once it is done.
  8. Now I am only learning Neowave, and there may be mistakes in my analysis, which I will be glad to correct upon pointed out.
  9. But the purpose of this analysis is to provide us with a broad possibility, or a broad road map, to guide our trading activities on shorter fractals.

Friday, October 04, 2013

Nifty - Technical Update

  1. GAPS in prices are like windows of opportunities.
  2. Last time we were supported by the gap between 5738.50-5673.60, this demand zone propelled us upwards.
  3. Now we are approaching another gap at 6024.55-5989.00, this should act as a resistance zone for the prices.
  4. Price behavior near this zone will tell us whether we have placed a medium to long term bottom in place, or this rise is just a corrective rally.
  5. One cannot miss the falling TL which is now being approached by the prices, even if we BO from this TL, we have a gap resistance right above it.
  6. So a host of supply zones are immediately above us, will the markets break through them or we are going to get badgered down again, remains to be see.
  7. I think one should think about protecting what they have rather than thinking of what one could gain, at such junctures in price.
  8. I would tighten my SL, and look for reentry if all these supply zones are taken out.

Saturday, September 21, 2013

Nifty - Elliott Wave Update

  1. Above is a monthly chart of Nifty, :).
  2. We are tracking a big triangle on Nifty, with possibility of an "upward" resolution.
  3. A "?" following wave {E} suggests that, we may need some more price action inside the triangle boundaries before Nifty gives an actual breakout.
  4. The possible triangle pattern marked is huge and is already in its 6th year. One can imagine what the thrust from this huge triangle breakout will be.
  5. Looking back over last 6 years this might be the best R/R scenario that has developed, with strong backing of the triangle pattern and its post pattern implications.
  6. One can clearly define risk in such a scenario, and possible rewards are tempting.
  1. Looking at the weekly picture, we can see the pattern developing in wave {E}is not yet done.
  2. A special type of "Neowave" triangle may be forming, which requires wave E to complete.
  3. We may see prices reaching our for the 5740-5680 range, to form the final or last low of this 6 year long triangle, corrective pattern.
  4. Classical Technical Analysts, may spot a possible "Inverse HnS", in the making, a BO from the NL of which, will give us the required impetus to begin a new bull market.
  1. On the daily fractal, we need some more time to finish this wave D, may be till expiry of current (Sept 2013) series.
  2. Next month may take us down towards the zone identified by us as the possible ending zone of the 6 year long triangle.
  3. The down move has to be a 3 wave move. Upon completion of which we might begin the next bull market.
Notes:
  • This analysis is being done on a very big fractal, and time targets mentioned anywhere in this post may lengthen/shorten as the market action develops.
  • The whole premise of the bull market rests on the perceived "triangle" pattern, and if it does not play out, the whole scenario may need a re-look.
  • My analysis attempts to identify, possible termination of known patterns, and then look for a low R/R scenario to trade. The counts and the forecast comes second, (Though this is in no way a trading recomendation.)
  • Targets for this potential setup has been reserved purposefully, as it depends on the individuals trading systems, to decide what the trade parameters will be. I will update my blog as and when I feel we are at a critical juncture of pattern development.
  • Most importantly, there is no compulsion for the readers to deliberate on what is shared on this blog, so if you don't like it, please look for better ones, that being said I always welcome constructive criticism.

Tuesday, September 17, 2013

Nifty - Technical Update

 
  1. Nifty has followed the script so far. We are bang in the middle of the consolidation zone discussed earlier (5750-5900).
  2. We have not yet broken out of the down slanting TL discussed in the last post.
  3. This consolidation should continue through this week, and may spillover in the next.
  4. I am looking for resumption of the up move once this correction is done with.
  5. One can gather additional clues from a shorter fractal, discussed below.
  1. This hourly chart shows we have hit a ceiling for the time being around 5950 zone. 
  2. We may need to correct towards the NL to find support and additional buyers to propel us through the down slanting TL.
  3. Look for 5700 odd levels to offer support in coming weeks.
  4. I am not yet sold on the short case, but should such circumstances arise, I will point it out accordingly.

Friday, September 06, 2013

Nifty - Technical Update

  1. Prices have recovered after the single day 200 point drubbing.
  2. This recovery has taken prices all the way up to the upper boundary of the resistance zone marked in last post (5600-5685).
  3. Now should prices break out from this supply zone, we have next one right after this, between 5750-5900.
  4. I am not sure at this point about what may happen if we enter this new zone 5750-5900, but it might tilt the balance in favor of the bulls.
  5. Of course a confirmation of a trend change would come once we break out from the slanting TL just above the blue box on the chart above.
  6. It would be very interesting to watch the prices if they reach the 5750-5900 band.
  7. Right now, till we take out 5685, there is a chance that sellers may return.
  8. Above 5685, we may test the upper boundary of the 5750-5900 band.

Monday, September 02, 2013

Nifty - Technical Update

  1. Nifty closed above a falling TL, indicative of a BO. But is this BO for real.
  2. Well we need more confirmation whether the down move is complete, or we are rising to fall again.
  3. For this up move to continue, we must take out the 5600-5685 band.
  4. We are already at a crucial resistance of 5566, if we take it out, then the resistance zone mentioned takes effect.
  5. The skies are clear once we take out these two levels, though.
  6. So keep your risks measured till the time all these resistances are taken out, till such time there is a real risk of sellers returning.

Tuesday, August 27, 2013

Dollar Index - Elliott Wave Update


  1. A possible pattern formation on DI.
  2. The possibility suggests lower DI in coming weeks.
  3. For that we need a clear BD from the B-D TL shown on the chart.
  4. If we do get a break then the first target is in the vicinity of 78 odd levels, and below that we should find support around 76 odd levels.
  5. But the break of the B-D TL is essential.
  6. The only hitch is the current down leg has already taken more time than preceeding up leg, a sign of market with an upward bias.

Wednesday, August 14, 2013

Nifty - Elliott Wave Analysis


  1. This Nifty chart clearly shows that we have found support at the earlier support zone, now tested 4 times.
  2. We also have a resistance zone brewing around 6090 - 6135 range.
  3. If this rally is for good, we can test this resistance zone, in coming weeks.
  4. The start certainly looks convincing. 
  5. If we do rally to this resistance zone, it will interesting to see what Nifty does there, a breakout above the last high of 6229.45 (which "investors" are hoping for), we may see much higher levels, in the vicinity of 6500 - 7000 (but this is just a conjecture at this point, we need much confirmation before any of this becomes a possibility).
  6. Right now I would be betting on the levels of 6090 - 6135 being reached before we make a new low or break the support zone.
  7. But markets are known to do there own thing, and I know that a SL will protect my capital!

Thursday, July 25, 2013

Nifty - Elliott Wave Update

1. The rising wedge is violated, and the first pause may come around 5800 - 5775.
2. Below this levels we may see even lower values.
3. There are multiple possibilities developing in the market and I will cover the big picture this Saturday.
4. For the time being the trend is clearly down, and the intensity warns us against treating this fall as just another retracement to the preceding uptrend.

Monday, July 22, 2013

Banknifty - Technical Update

  1. There are some very interesting things happening on the Banknifty weekly chart above.
  2. First since the start of 2012, we have been rising faster and falling slower, which is a clear indication of the fact that the trend is higher.
  3. Every time the indicators reached the OS levels we got a nice move out of it.
  4. So far since 2012 we had never violated a pivot low, which has occurred just now, but again this has happened with larger time taken to fall than to rise.
  5. So by this token the trend is still up, and we are once again at the OS levels on the indicators.
  6. For traders this is a nice reward to risk setup, my personal opinion would be to buy at these levels with a  small stop below last pivot low, and target towards the 61.8% retracement level of the last fall.

Friday, July 19, 2013

Nifty - Elliott Wave Update

  1. A rising wedge can be spotted on the Nifty, with negative divergences and OB levels on the oscillators.
  2. All this indicate that the current up move is losing steam quite like the character of a rising wedge.
  3. Add to that the supply zone overhead and the upper wedge boundary, we may be very close to a short term top.
  4. I believe 5970 would be an ideal level, a closing below which will be a strong signal of an end to this up move.
  5. A close above 6230 however will change our medium term outlook, please refer my last post for a longer term outlook, here.

Saturday, July 13, 2013

Nifty - Elliott Wave Analysis

  1. Nifty staged a sharp rally in last couple of days, marked with important announcements overseas.
  2. The next pivot resistances are coming in around 6130 levels, that is another 100 points away from current levels.
  3. But will we get there, and complete a classic (a)-(b)-(c) correction, remains to be seen.
  4. Right now, I think we are at a critical resistance once again, and this time the levels are 6020-6030.
  5. One can get a clear idea by looking at the 2 hour chart below.
  1. This chart clearly shows we have closed above the 5970 mark, which in itself is bullish, but the next bout of selling is likely to come in the 6020-6030 area.
  2. If we can cross this area, then the next 100 points should come easily.
  1. On the longer term though there is a doubt between what is the correct wave structure that is playing out, I have given 2 most likely option according to my limited understanding of the EWP and Neowave Theory, right now there are no preferred count, both are equally likely.
  2. One count suggests, that the second X wave is still in progress, and is forming a triangle pattern. Which suggests we should find resistance soon and fall again to complete the triangle. Once this triangle is done, we should see the thrust out of the triangle.
  3. Other count suggests, that the second X wave was done at 5477.20. And the wave Z may be forming a triangle or an ED. In both cases we have another couple of wave pending before we see a final top in place.
  4. Both the possibilities above are presuming that our long term count of a big flat correction is correct, and will play out. 
  5. So far the conditions have not changed to make us alter the count, but should things change, we will be there to inform you about them.

Thursday, July 11, 2013

Nifty - Elliott Wave Update

  1. Nifty has been in a sideways consolidation for last few days, it actually formed a flag/pennant.
  2. We have a clear BO today. As we have been reiterating, the band of 5870-5970 was critical for any up move.
  3. Right now too 5970 is very important, above that level we may test 6030 - 6130 band.
  4. We have an (a)-(b)-(c) move on our hand, and wave (c) should be equal to wave (a), which comes around the 6100 mark approximately.
  5. SL for this trade would be the last pivot low, around 5800 with current price around 5940 and with probable target around 6130, we get a reward to risk ratio of approximately 2.
  6. Oscillators are in OB zone, but during trending moves, they can stay OB for a while.

Monday, July 08, 2013

Nifty - Elliott Wave Update

  1. Nifty has been trapped in a trading band of 5910 - 5760.
  2. The resistance zone pointed out in last post is providing supply.
  3. We need to take out 5970 - 5910 zone for this up move to continue.
  4. We have a support zone around 5760 - 5730, which should absorb any down shock to the market.
  5. But the key remains the supply zone overhead, which needs to be taken out.
  6. According to EWP, since we have a faster retracement, we can begin a new count, for a possible upmove, we may have wave (a) / (1) behind us already.
  7. The indicators are moving towards an OS zone, which should be a good area to buy, a retest of previous pivot low at 5760, would be ideal.

Wednesday, July 03, 2013

Nifty - Elliott Wave Update

  1. Resistance offered in the resistance zone identified.
  2. Now the big question whether the trend is changing from down to up or we have resumed the downtrend.
  3. The key support comes at 5686, if honored, we may see atleast another leg up, or a possible trend change.
  4. If we breakdown from 5686, we have more downsides left.

Tuesday, July 02, 2013

USDINR - Elliott Wave Update

  1. USDINR was rising in a rising wedge formation since the 2008 equity market crisis.
  2. The trend is unmistakable, and strong, but from price extremes come big moves. 
  3. We have a potential for one such scenario playing out, but one must tread cautiously, as the underlying trend can spring back to life without any warning.
  4. There was a fibo confluence zone around 62 to 60.40, and we seem to have found selling pressure here, indicate towards a pause.
  5. Oscillators are in OB zone.
  6. Classical EWP practitioners would feel confident of pattern completion as the pattern preceding the last up leg was a triangle, which according to classical EWP precedes last thrust in the trend.
  1. There is a broad support zone between 58.92 - 57.30.
  2. The current OB status on the oscillators suggest prices should recede a bit. MACD is showing negative divergence (not shown on the charts).
  3. Below 57.30 we may see the larger trend reversing.
  4. The long standing support TL on RSI, should give an early warning of a reversal if violated.

Monday, July 01, 2013

Nifty - Elliott Wave Update

  1. The triangle mentioned in the last post resolved upwards, which most likely suggests that the bottom, at least in the short term is in place.
  2. The important hurdle though lies between 5870 - 5970. Once through this band we should see even higher prices.
  3. This resistance band may cause a temporary pause in the markets, if the pattern of the pause is a 3 wave move, this should be used as an opportunity to add to longs or create new longs.
  4. 5680 odd level should provide good support to any correction, should prices reach there.
  5. The current OB condition on STS and RSI also concur with the "pause" theory.
  6. As long as 5680 is protected, any OS condition on the ST charts should be used to buy into Nifty.

Wednesday, June 26, 2013

Nifty - Elliott Wave Update

  1. Tomorrow is expiry day, and what the markets will do is a million dollar question?
  2. Now trying to anticipate expiry day move is a difficult endeavor, and requires deep understanding of option data, and many other market factors.
  3. Here only EWP is used to anticipate the price action, this is in no way a recommendation to trade, but just an experiment.
  4. The chart above suggests that the price action from last pivot high is of corrective nature, and taking the shape of a DZZ.
  5. The last leg of the second ZZ, is showing clear 5 wave move, with market consolidating in wave 4, possibly a triangle.
  6. Once this triangle is resolved we will most likely get our wave 5 down. The funny part is if this triangle resolves in the upward direction, our view is invalidated.

Monday, June 24, 2013

Nifty - Elliott Wave Update

  1. Nifty is approaching a host of supports ranging from 5600 odd levels to 5475. The last pivot low rests at 5477.20, unless this pivot low is taken out there is a possibility of another leg up.
  2. Whether this leg up takes out the last pivot high around 6229.45 remains to be seen.
  3. The fall from last pivot high is looking more corrective than impulsive, and given the supports combined with possible +ve divergences, we may atleast see a pause to this vicious fall.
  4. Also prices have already taken greater time to fall as compared to the last rally and still have not retraced the rise completely, which means the larger trend should still be up.
  5. But all this analysis is anticipative, a wise trader always follows what market is doing, and right now it is moving down, unless there is a clear evidence that the trend has turned no long positions are warranted. Stop-losses can be tightened at best on shorts.
  6. The support zones mentioned above have provided support to the prices twice before, hope prices get third time lucky. But the overall picture is not encouraging, even though we may get a leg up, but the picture is turning bearish on a bigger fractal. Unless the all time high is taken out we cannot expect the bullish euphoria to return.

Tuesday, June 18, 2013

Nifty - Elliott Wave Update


  1. Here is a slightly modified count for Nifty.
  2. A double three, a flat followed by a ZZ, altered the end of wave (a).
  3. This count keeps the possibility of another up leg alive.
  4. But if we close the gap made during the island reversal and the preferably the low of the island, then this possibility loses its credibility.
  5. Till such time, due respect should be given to what markets are telling us.
  6. Clearly the long side had a great reward to risk ratio, but that is always true in a down trend, this is the only reason people fall prey to bottom fishing.
  7. But a clear chart pattern (island reversal), a plausible wave count, a BO above the TL, and +ve divergence in the indicators, all support the possibility of at least a near term bottom forming.
  8. We have clear validation and invalidation points for this view, till any one side is confirmed.

Monday, June 17, 2013

Nifty - Technical Update

  1. Nifty has tested a strong support at 5750.
  2. Went below it for one day, even closed below it, but bounced back smartly the very next day, as if rejecting that level completely. 
  3. In this process, we have got a typical chart pattern by the name of an "Island Reversal".
  4. Now prices should sustain above this gap, to confirm the pattern, and should see a nice up move from these levels.
  5. We have just broken above a falling TL, and barring the the gap down day (the island), we can safely say that the price action is contained well within a set of parallel lines, indicating that the price action is corrective in nature.
  6. So all this suggests that we are in for another up leg, but this would be possible only if we take out a crucial resistance band of 5970-5870, above which this upmove if it materializes should not find much resistance.

USDINR - Technical Update

  1. USDINR reached both HnS targets. (This pattern is really potent when it plays out.)
  2. And as with any rapid rise a pause is always good.
  3. We get a better idea by looking at the weekly chart below.
  1. There is a rising wedge type pattern forming on the charts.
  2. We have actually reached the upper channel boundary of the pattern too, so again prices may pause a while.
  3. Now technically we have reached the targets but there is a possibility of another leg up once this consolidation is done with.
  4. Also a possibility of a parabolic rise is there if prices take out the upper channel boundary of this rising wedge pattern.
Right now a pause is in order, which might give equity markets some respite. We have to keep a close eye on the pattern which may form during this consolidation, to get further insights in the markets.

Tuesday, June 04, 2013

Tata Motors - Technical Update

  1. TML is forming a rising wedge.
  2. We can spot a HnS too, marked on the chart.
  3. We have broken out from the NL, and we are consolidating above it, this is a bullish sign.
  4. We have first target zone 338-345, but we need the broad markets to support it.

Nifty - Elliott Wave Update

  1. Nifty did correct from the resistance zone of 6140-6070, and fell down towards the previous support zone of 5970-5935.
  2. This support zone has held prices for last 2 days, also a 3 wave move is visible on the charts.
  3. Now if this support zone is respected, we might have seen the completion of wave {a} or even wave (b). in either case we may see prices rising from this support zone, and head towards the top of wave (a), at least.
  4. If prices break below this support zone convincingly, we may see further down move towards 5750 levels.

Thursday, May 30, 2013

Nifty, Banknifty, Infy - Technical Update

  1.  Possible HnS marked on the chart.
  1.   Possible HnS marked on the chart.
  1.  Possible HnS marked on the chart.
This is not a post to tout another trading opportunity, but if you can squeeze one out of it, good for you. This is  just an interesting observation, lets see how.
As with every trader, I have my ways of  identifying possible supply and demand zones in the markets, and the above charts are examples of 3 markets which according to my analysis, MAY be at or near a supply zone. Now this is exactly what as a trader I am on the lookout for, a possible supply and demand zone, and a good clear CTA pattern with clear entry and invalidation objectives. 
If this supply zone plays out, then these small HnS patterns could be the ones, which will prove to be the exact entry point in to the markets, of course if we trade above the top of the head, this pattern invalidates and so will be my supply zone. Then I will have to get back to the drawing board I guess.

Tuesday, May 28, 2013

Soybean - Elliott Wave Update

  1. Soybean futures are at a crucial juncture.
  2. We saw a stupendous rally last year, and prices touched a high around 5000.
  3. We are back to the time (sowing season) when there is a supply crunch in the markets and the demand is high.
  4. Technically speaking, we have a sharp 5 wave rally last year wave [3], preceded by a 5 wave move wave [1], and also followed by a possible 5 wave move in wave [5].
  5. Of this latest 5 wave move, we have waves (1)-(2)-(3) done, wave (4) is in progress, and hopefully wave (5) should follow.
  6. Ideally prices should go above the top of wave [3], atleast close to it.
  7. So once this correction in wave (4) is done, which I feel is quite close to finishing, we should see prices rising.
  8. Whether we take out the previous high, or fall short of it, I cant tell now, but we should surely get a tradable up move in coming months.

Monday, May 27, 2013

Nifty - Technical Update

  1. Prices broke down from the lower channel line of a broadening triangle.
  2. Now pulling back, the interesting thing to watch is whether prices find resistance at the lower channel boundary.
  3. A nice reward to risk short trade can be taken here, with SL above the lower channel boundary.
  4. If prices find resistance then we are in for even lower prices.

Friday, May 24, 2013

Nifty - Technical Update

  1. Nifty has reversed from an important resistance zone. 
  2. Prices have met with supply in this zone twice before this weeks price action.
  3. Big bearish engulfings, have resulted in sustained down moves, and this time time too it may turn out to be the same.
  4. Since this is the turning point, understandably, people, traders, investors are torn between bullish and bearish arguments, and, interestingly both would be equally impressive at this juncture.
  5. But a big bearish engulfing in an establshed supply zone, with RSI -ve divergence and higher prices with falling volume, all indicate towards at least a temporary top in place.
  6. The rising wedge is unmistakable and so would be the aftermath, if it plays out.
  7. I would again like to state the obvious, that, should prices resume their upmove and take out the supply zone marked in the chart above, we should see even higher prices.

Crude - Technical Update

  1. This is the daily chart of Crude, my earlier view of a three wave move was falsified (refer last post here), but we got another bearish formation in the bargain, perhaps with a more severe reaction to follow.
  2. We are forming a rising wedge, and though we momentarily shot over the resistance zone, we are promptly back below it.
  3. So far the rises were fast and corrections were slow, but if this were to reverse that is if falls start taking lesser time compared to upward corrections, we may as well conclude, that a down move is beginning.
  1. The triangle on the weekly chart is still in contention.
  2. Prices were beautifully resisted at the upper TL of the triangle.
  3. Now if we do not BO above the upper TL soon, we may test the lower boundary of the triangle.

Thursday, May 23, 2013

Rcom - Technical Update

  1. RCOM has a resistance zone in the 113-131 band.
  2. Volumes are rising, should be indicative of a bottoming formation.
  3. The sharp rise in RSI above the OB zone suggests a possible fundamental shift from a bearish to bullish view.
  4. But the current OB condition should delay the eventual BO.
  5. I don't understand the business of RCOM, but since the name Reliance features in the company title, I believe a BO should result in a sustained move.

Dow Jones, Dollar Index - Technical Update

  1. This is the chart for Dow Jones showing the last rally since 2009. We have broken into new high grounds, but certain points need to be pondered over.
  2. Thought the rally is looking strong, it is still contained within parallel lines, and that tells us that this price action is still in the corrective realm.
  3. Prices are approaching the top boundary of the corrective channel, at the same time RSI is in OB zone, getting resisted at the previous peak in RSI, giving rise to a sort of negative divergence.
  4. Most obviously the last peak around 14200 odd levels, becomes the key level, should we break below it, we can call at least a short term correction to this rally, if not the start of a new bear market.
  5. In lieu of gathering more evidence supporting our view, I have attached chart of Dollar Index below, which makes some startling revelations for us.
 
  1. The whole correction post the rapid fall from 2002 - 2005, so far looks like a rounding bottom to me on this monthly chart of DI. We had earlier proposed a view that this correction is a pause in the existing downtrend, and is taking the shape of a triangle, refer here.
  2. But some new developments warn us against such a possibility.
  3. We can see that, Prices have been getting resisted at the falling trendline (blue color), and also making higher lows, at the same time.
  4. But the interesting thing is that similar pattern is forming in RSI, and RSI has given an advance BO above its own falling TL, more often than not prices follow suit.
  5. So if DI is giving us a BO above a multi year TL, then surely this will not augur well for the equities, aka DJIA.
So my final word on it is, should we get a BO in DI, then we are in for a turbulent times in equities, and economy in general.

    Wednesday, May 22, 2013

    USDINR - Technical Update

    1. Rising wedge in USDINR.
    2. Bullish in medium term, and bearish in long term.
    3. There are many alternate possibilities, but prices should test the A-C trendline, before anything else!

    Idea - Technical Update

    1. Possible HnS in Idea, a smaller hns in the right shoulder as well.
    2. A BD below the NL should give a tradable move into this expiry.
    3. A very good Reward to Risk ratio trade, with an obvious SL above the high of the smaller head at 132.70.

    DLF - Technical Update

    1. DLF got resisted in the zone we mentioned a couple of days back, refer last post here.
    2. Now the question is will the support zone of 230-225 hold the prices this time.
    3. If the correction is done, then the support should give way, otherwise we might find support in this zone once again.

    Tuesday, May 21, 2013

    Silver - Elliott Wave Update

    1. Silver had a stupendous run, and everybody's aware of it.
    2. Many are now feeling sour as Silver did not reach the moon (as promised by brokers, advisers, et all), and they are stuck with long (even worse physical Silver) positions, very close to the moon. The only problem is, prices are closer to earth and are coming further down.
    3. But is there a structure to this down move, and to the upmove that preceded, well fortunately there is, and that might help us realize where exactly are we in the big picture, and where shall we get an opportunity to reduce our holdings (and pain) at a better price.
    4. We are in a corrective counter trend move (as EWP suggests us), and though the correction may not be over, it will certainly give us upward spurts in prices, to lighten our holdings. So when do we know that there is a spurt coming, well whenever the prices complete a clean 3 wave corrective move, we will get an upward spurt.
    5. Is there a chance like it on the horizon? Well we cant be certain about it (for that matter about anything) but we can surely put odds in our favor a little bit just at the right time, by using EWP.
    6. We are in an [a]-[b]-[c] downmove, and the wave [c] as always consists of 5 waves.
    7. We are currently in wave (3) of [c] which means there is some more downside before we complete this wave [c]. So far as this wave [c] is incomplete, any bounce we might get will be promptly sold into.
    8. I can identify some support zones on the chart, where Silver might find some demand.
    9. We are currently in one such area between 41875-40000, below 40000 though the next area of support comes around 33900-31600. Also notice the lower boundary of the falling channel.
    10. All these observations suggests that one should not hurry to jump on the long side, wait for the prices to complete their course, show signs of reversing at important support zones, and then buy. Till then enjoy the toboggan ride!

    Monday, May 20, 2013

    DLF, Reliance - Technical Update

    1. Above is a daily chart for DLF, the counter has spiked perfectly in the resistance zone, refer previous post here.
    2. We may see prices traveling all the way down to the lower band of this trading range.
    3. One may notice a peculiar pattern in the RSI indicator.
    1. Reliance is looking like it has managed a corrective rally, I had pointed out that prices may trudge higher (refer previous post here), but now the pattern looks complete.
    2. Also one might notice that this complete rally looks like it is a part of the right shoulder of a big HnS pattern.
    3. If this is true, then we are in for an immediate downmove till the NL, and below which we may see prices falling even further.


    Nifty - Elliott Wave Update

    1. Nifty is now in a precarious zone. I was hoping for a new high.
    2. But prices have completed the minimum requirement for an ED, and this pattern is usually followed by a sudden and abrupt reversals.
    3. The longs should be trailed with close stops, so long as we are not in an uncharted territory, once at an all time high, we can do nothing but follow the prices.
    4. Volumes are falling continuously, so traders and investors alike, should be on their toes.

    Friday, May 17, 2013

    Nifty - Elliott Wave Update

    1. Just a thought, about this rally in Nifty.
    2. Please remember, this is not a recommendation or trade idea.
    3. I was just trying to count the waves on this Nifty rally, and I could find 3 legitimate possibilities.
    4. One calls for a start of a medium term down move, one calls for a pause, and last one calls for continuation of this up move even further up. The possibilities are marked on the chart with appropriate labels (are open for discussion).
    5. This is an ideal time to tighten stops, a few counters are showing patterns with bearish implications, but one should not trade against the trend, let the markets tip their hand. 
    6. Till then either watch from the sidelines, or trail your long positions.