 |
| Weekly Chart |
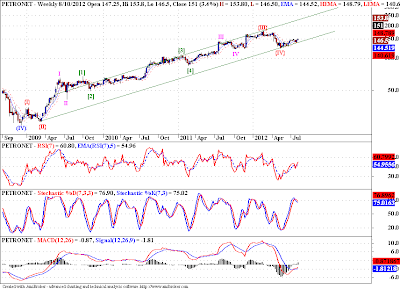
This is a weekly chart of Petronet, we can see a clear trend in the scrip.I have tried to label the chart according to EWP. I think we may be in the last wave of this up move so far, unless we are still in the extending third wave. Still if our count is correct we may see prices exploding soon. We may be forming a series of 1-2/1-2 waves, as can be seen from the daily chart below, but for this pattern to play out, we must breakout from the rising blue channel asap. If we get resisted here, we may not have yet completed the wave {IV} correction, n that case we may see lower prices in coming days. But both these possibilities don't have much time left, eithr of them should play out, sooner than later.
My personal choice of trade on Petronet would be a long on the breakout from the rising channel, with a stop loss below 139.25, which is the latest pivot low. I would target minimum 180 the high of wave {III}, and prices may even touch 220-240 range if supported by strong markets.
 |
| Daily Chart |


No comments:
Post a Comment
...I am thrilled to learn what you think about this piece of content...