 |
| Weekly Chart |
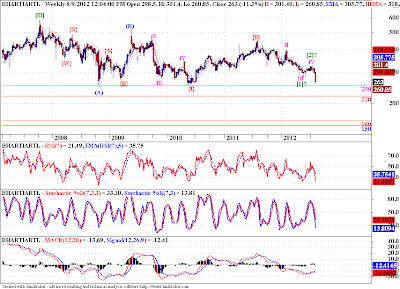
This is a weekly chart of Bharti. Please refer to our last post on Bharti here. We were counting a triangle in wave (IV). But it seems we have already completed a clear 5 wave sequence on a much bigger fractal since 2003 (Please refer monthly chart below). The invalidation point for the triangle count was around 250, if we break below it we will see much lower prices in coming days. The question to ask here is, what will happen if this triangle pattern is invalidated? And the answer is an (A)-(B)-(C) type correction, a 3-3-5 pattern, of which we will form the last wave, a 5 wave decline in wave (C). I have tried to mark the waves on the chart above, and as you can see, if we break below 250 the next chance for a support, although very slim, is at 220. Below that the next plausible support comes at 160-150 range. I would say, below 250-220 any hopes for a rally will have to be relinquished to the bears.
 |
| Monthly Chart |
Note: This chart also constitutes a great example of how EWP helps us even if we are wrong. Our expectation of a triangle, though yet to be invalidated, seems to be under serious scrutiny by the market itself. So by applying EWP rules and guidelines we can chart out next best count, and adjust our trading actions according to it.


No comments:
Post a Comment
...I am thrilled to learn what you think about this piece of content...