 |
| 4 Hourly Chart |
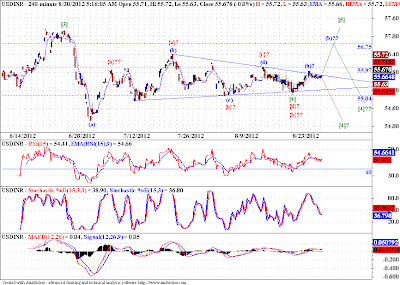
This is a 4 hourly chart of USDINR. Again this chart throws at us multiple possibilities. My preferred count is bullish on dollar. Two of three probable counts are bullish, one is bearish. The invalidation of the bearish count is above 56, whereas invalidation for bullish counts is below 55. All levels are for spot USDINR.
One of the bullish count suggests we may rise till 56.75 in wave (b)?? and then come down in wave (c)?? of [4]??.
Bearish count suggests that we have completed a triangle pattern in wave (b)? and should not come down in waves (c)? of [4]?.
Lastly the preferred count suggests that we have completed triangle in wave [4] and are now rising in wave [5]. We may have completed waves (1)-(2) of [5].
Preferred count - Wave label not followed by anything.
Alternate count I - Wave label followed by ?.
Alternate count II - Wave label followed by ??.
Note: Some readers have a problem with my analysis. The argument is that the "discussion of multiple possibilities in a market tends to be confusing and does not add value". I would like to say, I am just discussing probabilities here, it may sound defensive to some, but its the truth. I have a trading method as everyone who is dabbling in market is expected to have. I use EWP to become aware of different probable scenarios in the markets, and then trade the one which gives me highest "expectation" using my trading method. Now as with many people around me, this concept may be a little hard to digest, or may be plain wrong, for the readers, but I cant help it. If I sound confusing, then may be I am, but it is preventing me from losing money in the market, I would take that bet any day!


No comments:
Post a Comment
...I am thrilled to learn what you think about this piece of content...