Saturday, December 29, 2012

Dollar Inder - Elliott Wave Update

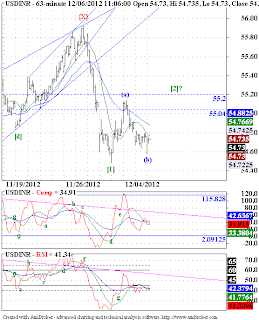
  1. I could count the fall from the point marked "Imp Top" as an impulsive move, with wave (5) extending. Now the reason I am saying that the wave (5) extended is because of the subsequent market action, which almost completely retraced the wave (5), marked as wave (a) a 3 wave move.
  2. But that may not be the end of the correction, as the move down that followed was also a 3 wave move, marked (b). Now two 3 wave moves back to back suggest one of the 2 possibilities, either we are forming a flat or a triangle. In any case we should see higher prices in DI from current levels.
  3. Now if we are forming a flat, we will see a 5 wave move in wave (c), that should take us back into the range of previous wave (4) as well as in the range of wave (a) top. 
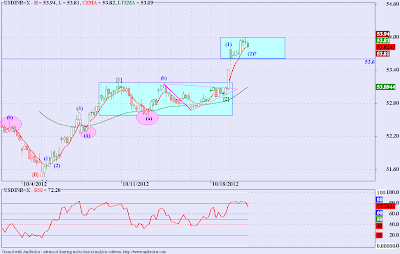
  4. Now the last time I posted on DI we caught the top of wave (a) on the exact day of the reversal, refer the chart here. We get lucky some times. This time I feel we should head up in wave (c). But whether it is a 3 wave move or a 5 wave move, only time will tell.
  5. My personal preference is towards a 5 wave move, because my larger count (refer here) suggests we have further downside in DI. So a corrective pattern following an impulse should mean another impulsive pattern to follow, in our case to the down side.
  6. I have a bad habit of making minor changes to my EW counts, and sometimes change them altogether, but always in response to market actions. So bear with me, if your goal too is to catch important turning points in the markets. I try!

Tuesday, December 25, 2012

Nifty, USDINR - Elliott Wave Update

An update to my last post on Nifty and USDINR.
  1. I posted a ST bearish but MT bullish count on Twitter, recently (access it here). Now I am posting an alternate, which is ST bullish but MT bearish.
  2. As per this count, we may be in wave B of an A-B-C ZZ. Which means we will have another leg up, once we finish this wave B correction.
  3. So far we have sustained above the GAP area, which has been a strong area of demand AKA support for the prices. The longer we sustain above the GAP, the stronger the possibility of a leg up, conversely a BD below the GAP would be bearish.
  4. Another support comes at 5800, should we break below the 5850 support (if at all should be tested intraday, no closing below the GAP).
  5. We have almost taken 161.8% time of A in wave B. We have another GAP area (5922.50 - 5897)  just above prices, a BO above this zone should be a good signal to enter into longs. We should at least test the upper boundary of this consolidation around 6000. The targets for this move may lie between 6360 - 6380.
The reason for this alternate count is the development in the USDINR.
  1. We might have ended a characteristic terminal pattern in wave [c] of II of this irregular flat pattern.
  2. If this pattern as marked by wave II on the above chart is complete then, it would suggest that we move further down the chart at the earnest.
  3. On a larger fractal, we have a possibility of a bigger flat pattern developing, of which the current down move from the highs of  55.90 odd levels (marked {B}) is the wave I of an impulsive down move in wave {C}, followed by a corrective wave in wave II.
  4. We must break below the lower boundary line of this terminal pattern.
  5. The targets for this down move would be what we can expect of any 3rd wave, at a minimum, it should be 161.8% of wave I. (I will update it on twitter @aniruddha4tew) should the prices choose to follow the count shown on the chart.
  6. Right now it would suffice to say that, a BD below the lower boundary of the terminal will change this market into a sell on rise market.
  7. The "saucer" pattern mentioned earlier (access if here) fails below the last pivot low of 54.645. Though the pattern may fail, I would urge the readers to look at it with a different perspective, it is a great example of combining two studies to give us actionable scenarios. For instance, as the EW count was inconclusive, we got a hint of possible up move using CTA (Classical Technical Analysis), whereas since the count is becoming clearer we are well informed, in advance, about possible failure of this classical pattern.
  8. As I have repeatedly said my objective is not to be on the wrong side of the markets, markets will eventually take you with them in the right direction, if you persevere!

Monday, December 24, 2012

Crudeoil - Technical Update

  1. We can see a diamond pattern developing on the weekly chart above. More often than not it will act as a reversal pattern.
  2. But the pattern may not be complete as of yet. We might need another leg up, before we can say that the pattern is done. We should get resisted at the upper boundary line of the pattern and subsequently break down from the pattern lower boundary to confirm it to be a diamond reversal pattern.
  3. On the other hand we might just breakout from the upper boundary, but in that case the pattern we are thinking to be a diamond reversal, will turn out to be just another continuation triangle.
  4. The key lies in following what the market is doing presently, and for that we might need a closer look, lets look at the daily fractal.
  1. On the daily fractal, I could spot an Inv HnS, I might be looking too hard for a pattern here, but as long as we get a good trade out of it, its alright.
  2. We may have actually broken out of the NL, but the volume is not conclusive yet. If we are to continue up, we should see good volumes sooner than later.
  3. The target for this Inv HnS sits pretty around 5290, conspicuously close to the upper boundary of the pattern. So should we see a good up move in CrudeINR, we should see some resistance coming around the upper boundary of the proposed diamond pattern and/or 5290-5300 levels. We are forming a small consolidation right at the NL, I feel I would be buying any BO from this consolidation, with SL at its lower extreme.

Wednesday, December 19, 2012

Stock Ideas

  1. Andhra Bank is sporting an Inv HnS. As it usually happens we get 4 touch points to form a triangle, inside an Inv HnS as marked on the chart.We have broken out of the NL.
  2. Whats interesting is the fact that we are already testing the NL, forming a small flag.
  3. A BO from this flag should indeed be rewarding. Keep SL at 113.
  1. Central Bank on a similar note has broken out of the Inv HnS. The right shoulder of this Inv HnS is an Inv HnS too.
  2. We have tested the NL, and now should advance steadily towards the measured target of 100. We can keep a SL at 79.
  1. Punjlloyd has been in a devastating down trend. An interesting development is seen throughout last year. We have formed a triangle, which may act as a reversal pattern, at least for the short term.
  2. We have staged a BO from the triangle upper boundary, also tested it by forming a flag. A BO from the flag should be bought.
  3. The measured target comes around 75. A SL of 57 should be kept.
  1. Rpower has formed an Inv HnS. With obvious implications of  an up move if NL is broken. In this stock, we have a flag forming below the NL. Sl the BO from the flag should also break the NL, for this to become a valid trade.
  2. A SL should be kept at 97.50. If this pattern works out fine, we may see Rpower in higher 130's.

Thursday, December 06, 2012

USDINR, Nifty - Elliott Wave Update

  1. USDINR looks like it is forming a wave [2] correction of a flat variety. We may see possible tgt zones for wave (c) of [2] around 55.04-55.20.
  2. RSI has gone flat the the bull zone, which is usually a bullish sign.
  3. We got a spike down today, now we are consolidating, which means we are forming another flag pattern, and a BO out of it should lead to a tradable move.
  1. Nifty has a gap at 5868.05-5837.15. It may offer support for a while, but ideally we should test 5800, in wave (2). We cant predict the structure for wave (2) as of yet, but it should be at a minimum a 3 wave move.
  2. RSI has reached bull zone in a jiffy, it should get some support at the bull zone.
Note: These are short term charts (hourly fractals), if the market changes its gears from bullish to bearish, the count proposed on the chart may change.

Tuesday, December 04, 2012

EURUSD, DI - Technical Analysis

  1. The 4 H chart of EURUSD above shows a possible Inverse HnS. Now we have already broken out of the NL, suggesting we should target the minimum requirement for this pattern which comes around 1.3360, thats a big distance away.
  2. Many things can happen in between, first of it would be a possible resistance at the green TL overhead, which is actually a NL for a bigger HnS on daily fractal.
  3. If we take out the green line, it would be again very bullish, as then the possibility of a higher tgt as per the bigger HnS would come into play.
  4. If we count the whole rise from the last low around 1.2650 as impulsive, I have something to add. If wave labels are as shown above, then the wave 3 may be the extended wave, but then wave 5 could not go beyond 61.8% of wave 3, if it has indeed crossed above that mark, tow possibilities exists. One wave 5 may be extending, in which case it has much further up to go (supports the HnS case), or the wave 3 is subdividing (which again supports our case for higher prices). 
  5. So apart from the green TL above I cant see any serious trouble to our view of higher prices.
  1. Now this is a super bullish possibility. We can see a clean Inverse HnS here, and unless prices cross below the possible right shoulder low, this count is in effect.
  2. We may get resisted at the proposed NL, and form a small sideways correction, but should break out on the upside.
  3. The possible triangle at the end of proposed left shoulder provides a slew of resistances for prices to churn about, but that should be a time issue instead of a price issue, on the other had if we could break out above it in relatively less time, then that would add tremendous fire power to the bulls.
  4. Especially the last two peaks in the triangle would be critical.
  1. To add credence to our bullish EURUSD outlook, I tried to see how DI is behaving. 
  2. We can see a possible mirror image of the EURUSD HnS on the 4 hour fractal on DI, with possibly the same implications.
  3. There is a caveat, about possible support at the black horizontal support line, discussed in the comment on the chart.
  1. The daily chart however is the one which gives us confidence to expect more downside in DI. If our HnS on the 4 hour fractal is correct we may see the tgt for that HnS around the blue line shown on the daily chart.
  2. This blue line incidentally may form the NL for a bigger HnS in DI, quite similar to EURUSD. Now we have already crossed below a minor support shown by black line on the chart above. And the next support range may come around the blue line marked by a black rectangle, which is actually the tgt zone for the HnS on the 4 hour fractal.
  3. So all in all we have a lot of evidence to suggest that we may have at least some room on the downside before we can expect some meaningful support for the DI (blue line), but below that we may see losses extending much further.
This analysis is just to share possibilities in the two markets discussed above, this is not a recommendation of any sorts, nor is supposed to support or refute any form of TA or theories. My objective is to be a profitable trader, and hence sharing with those who care, things which I care about.
Your opinions, comments and criticisms are welcome, but only condition is them being constructive.

Monday, December 03, 2012

Bharti - Elliott Wave Update

  1. First of all our initial view on Bharti should be considered under the light of, the author being extremely bearish at the time of the post, I try to follow the markets and that is why, may at times fail to catch the big picture. The market situation is interpreted in a very different manner today, so kindly give me some leeway. 
  2. Given the possible market action in near future on Nifty as discussed in my last post, I have tried to take a fresh look at Bharti, also using the futures charts, instead of cash charts in our last post.
  3. The support zone on cash charts of 250-220 was not violated by the market, the lower boundary is intact (ignoring the flash crash low).
  4. Now the stock has risen sharply in last few days, also the count suggests that we may have formed 3 corrective waves so far marked (A)-(B)-(C). The most likely implication still would be a triangle in wave [IV]. We may once again test the 460-444 range on the chart above in leg (D) of the triangle, a brief pullback to complete wave (E) of [IV] and then we are off on our wave [V].
  5. The formation looks like an ascending triangle, and a BO above the long standing TL in RSI would indicate a possible future BO in prices above the 460 level.
  6. Right now the markets are looking very bullish, and I would rather buy the dips instead of trying to pick a top. The markets will give ample time if it plans to go down. But considering the overall pattern being a bullish one, I would not encourage any short positions.
  7. Bharti completed a nice corrective pattern, down in wave (C). It also gave a nice contracting triangle in the last wave of this correction. That was a long window of opportunity, if you are not already long in this stock, I would suggest to buy on dips but keep the volumes light as the rise has been very sharp. If we get a BO above 460, then there is a possible case for a positional long play in Bharti.
  8. Till then keep it small and quick.

Saturday, December 01, 2012

Nifty - Technical Analysis

Monthly Charts
  1. There is a possible ascending triangle deveoping on the monthly chart. The volume as with every consolidation is falling. We are good as long as the expected breakout occurs with heavy volumes.
  2. The indicators show a possible advance breakout on both composite and the RSI indicator. The RSI advance BO is particularly more reliable.
  3. To existing traders there is no need to emphasize the possible price action that may follow given a good high volume BO from the top boundary of this ascending triangle, which lies in the 6330-6350 range.
Weekly Charts
 
  1. On the weekly chart we can see a smaller symmetrical triangle within the bigger ascending triangle. Here to the volume has been consistently dropping. But the only thing to worry about is the lack of surge in activity as the top boundary of the triangle was violated. The only reason I could think of is may be the bigger triangle need to be resolved to bring back the participants.
  2. The RSI indicator has broken out from the falling trend line of the triangle. Also it came back to take support on the trend line, that is typical development once a triangle BO occurs. Till RSI breaks down below the 45-40 range on RSI we can safely say, barring occasional pullbacks to alleviate the OB conditions on lower fractals, we are in an up trend.
Daily Charts
  1.  On the daily chart we have broken out of a flag pattern, which is a continuation pattern, it signifies the trend is still in force. The volume also rose on last couple of trading sessions, which is a good sign.
  2. The RSI has reached above 70 levels, to many this is a sign of trend reaching maturity. But the first time it reaches such an extreme in a comparatively less time, it means the market is preparing for a new trend. Any pullbacks towards the 60-65 range, with continuation patterns on the price chart should be bought into.
The only cause of concern may be the lack of surge in volume, which may pick up as the trading progresses. A new high would certainly go a long way towards bringing in more participation.

Thursday, November 29, 2012

Possible Trade Ideas for Tomorrow

Flag in DLF, suggests more upside. May be a half mast pattern, the move preceding the flag should follow, tgt around 215.
HnS in Maruti, NL broken, even retested, possible target 1455.
Possible F pattern in Tatamotors, we may see up move if we breakout, from the consolidation.

Sunday, November 18, 2012

Dollar Index - Elliott Wave Analysis

Weekly
The weekly chart of DI seems to forming a triangle in wave {B}. We may be in the last leg of wave {B}. Wave E of {B} seems to be forming a double three correction. I feel there is more upside left before we call an end to this wave E of {B}. The detailed count is shown below, on daily fractal.
Daily
This chart shows the labeling in detail of this last advance in wave E of {B}. We can see RSI is treading strong, and has crossed the 65 level mark, this suggests the trend is strong, and any pullback would most likely be bought into. Also there is no long term bearish divergence forming yet on both Weekly and Daily fractals, that again should add credibility to further strength in DI. Though my use of a single indicator here may seem insufficient, but two other popular indicators Stochastics and MACD (not shown here) too tell the same story.
Now I may be wrong, and DI may turn down, or I may be more wrong and DI just breaks out into the much anticipated "deflationary depressionary" rally and invalidates the bearish triangle pattern. But my analysis tells me to expect more price action before calling an end to this triangle pattern.
As a safety measure I would say, if DI trades below 79.65 then this wave E can be deemed complete. But above that level there is always a chance of further upside.
Ideally I would love to see a flat pattern in wave [y] of E of {B}, as that would mean a progressive loss of strength in the rally, and a corresponding built up of strength of the decline that may follow post completion of this triangle pattern. Even a failure of wave (c) of [y] of E of {B} is welcome, but we need a clear 5 wave move that fails to take out the wave (a) top, to confirm this count.

Note: Neither Neowave nor Classical EW is endorsed here in particular, I use both of them together, much to the dismay of ardent followers of either of the theories. I was a classical EW follower first, but was compelled to study Neowave by fantastic analysis by a fellow trader. But now I am stuck in between, and actually liking it. You get best of both the worlds, better risk management, what else do we traders need. But for analysts its a different story altogether, and I can't and won't fight them, so my dear analyst friends please don't bother. But if my trader friends want to add something they are more than welcome here.
Though this website is about trading, I am not offering any trading advice, this blog is to share my ideas with like minded people.

Saturday, November 17, 2012

USDINR, Nifty - Elliott Wave Analysis

A monthly and weekly fractal charts are attached above for USDINR. Let me make it clear in the beginning, that the EW counts on the charts are not permanent, they are subject to change and are the best I could manage at this moment. Taking it further, I believe we may not have finished the advance that begun in mid 2011. I can see a "rising wedge" type of pattern developing, and we may need another new high before we can think about the completion of this pattern. My guess is we may find resistance around 57.35 range. One caveat though, if we reach the 57.35 level, and reach there in relatively short time span, the technical position need to be checked before making an opinion about the future direction of the markets. Right now momentum indicators are waning with each new high. That should alert us, while expecting more upside in this counter, but there have been instances of multiple divergences and even multiple divergences failing. So stay with the trend till there are clear signs of revealing.

Today, I am proposing a radically bearish count, for Nifty. There is a chance of a wave [5] of wave {B}having failed. Once again, the counts are subject to change, one must constantly measure the technical strength of the moves to keep a tab of developments in the markets. But if the wave [5] failure gets confirmed, we could start our way down on wave {C}, and the consequences need not be explained to an Elliottician. We can see that the momentum indicators are diverging and that is never a good sign. The overall structure of the momentum indicators is not in favor of a long term advance, the technical structure for the whole up move of 2012 is akin to a "bear market bounce" at best. If some critical supports are broken on the downside, we may see the down move accelerating.
On the shorter term though, what is important is to try and anticipate where this current fall, may find support, so that a bounce develops, and we can better position ourselves for a deeper cut, presuming our wave [5] scenario plays out. There is an important gap area at 5530-5455, we need to monitor how prices behave around this level to get a clue about future developments in Nifty.

Note: I don't mind criticism as long as it is constructive. I can't predict the future, neither do I want to, I follow my trading system, and try to share what I have gleaned with those who find it useful to listen my views. Please forget what I have written if you don't find it useful, after all we have all read newspapers (much worse financial media) at some point in time in our life.

Saturday, November 10, 2012

Gold, Nifty, Banknifty - Technical Analysis

Nifty Daily
Nifty correction may extend, if we break below the support zone of 5700-5680. The fall may extend to 5595, and even further (less likely) to 5535.
Banknifty Daily
Banknifty seems to be forming a flat correction. Support may come around 11200-11070 levels. But one should be watchful of 5700-5680 levels on Nifty. If that support holds, Banknifty may not reach its target levels.
Gold Daily
Gold has staged a smart rally. But I am not completely sure that we have embarked on a new uptrend. The price area between 31900-31740 is crucial. If we sustain above this band we may, start the rally. But getting resisted at these levels is not a good sign, at least in the short term. In that case, the correction may extend down.
Gold Monthly
The monthly chart of gold shows a typical pattern. The first set of diverging blue line, on volume and price ranges from mid 2010 to mid 2011. We can see that prices moved up and volume decreased. Contrary to popular wisdom, that rising prices and falling volume is bearish, prices exploded soon afterwards. Now the second set of diverging blue lines, ranging from late 2011 till date. Here too we have a rising price structure in conjunction with falling volume. Not sure what will follow. But if the old pattern is recurring, then a break above the resistance zone identified earlier around 31740-31900, may repeat history.

Thanks a lot for your precious time!

Wednesday, November 07, 2012

USDINR - Elliott Wave Analysis

This is a weekly chart of USDINR. The count suggests that we should now come down in wave (D). The possible target would be in the 49 range. Please be mindful of the fact that this is a weekly fractal, and correspondingly take much more time to complete.

This daily chart shows the developing wave (D) id detail. We may be forming a {W}-{X}-{Y} correction. Lets see where prices take us. Presently prices are facing resistance in the 55-55.25 zone.

Nifty - Elliott Wave Analysis


Monthly chart suggests, we are in wave C of {B} of (C). We may have some more upside left to complete this wave C. Once this is done we may expect wave {C} down.
The weekly chart shows the internals of wave {B} in detail. We have an extended wave [3] of C of {B}. The price may find resistance at the parallel lines drawn on the chart.
We can see the details of the extending wave [3] in this daily chart. Waves are developing beautifully. We need to make a new high above wave (3) to complete wave (5) and then a 3 wave consolidation to complete wave [4] and ten last dash up to get the wave [5] over with. That should complete wave C of {B}, and then we can anticipate a 5 wave decline in wave {C}.

Note: This is a big picture forecast of Nifty. This should be used for analysis purpose, and not to trade. The idea is to integrate your trading system with long term EW counts to help you take decisive action at critical junctures. Labels with "?" behind them suggest the count is not complete yet. (Futures charts are used.)

Saturday, October 27, 2012

Nifty, 10 Y GOI Bond - Technical Update

10 Y GOI Bond
Nifty
I was looking at the 10Y GOI Bond Yield Chart. Earlier I was expecting the rates to rise, but rates have just flattened since then. But then it struck me that the pattern that the Nifty is forming is strikingly similar to what the 10Y Yield has be forming. Also the pattern looked like a classical chart pattern Head and Shoulders. Now in the crash of 2008 in India bonds also crashed hard. I am expecting that the current rise in Nifty is of corrective nature, and at this point in time there is not evidence to suspect that we wont fall. 
Of course classical chart patterns fail often, and I am not an expert in their interpretation at all. But still I feel this information was worth sharing. Please refer the charts below for similar behaviors of Nifty and 10Y Bond.
10 Y GOI Bond Crash

Nifty 2008 Crash


Thursday, October 25, 2012

Crudeoil - Elliott Wave Update

Crude Weekly
Crude Weekly Indicators
EW Perspective
Crudeoil broke below all important B-D trend line.  If our count is correct, we should see sharp falls in Crudeoil in near future, since we have completed a terminal pattern (triangle) in wave {Y} of (B).

Technical Indicators
RSI -  On the above chart shows a contracting formation, synonymous with a triangle. RSI has been oscillating about the zero level, with decreasing amplitude, if we see a convincing break below the B-D trend line, RSI may sport a zone shift from the bullish to bearish. 

ROC - ROC has formed a huge bearish divergence, chart attached below, with contracting formation towards the more recent price action. Since the completion of wave D, ROC has been listless, a break below the lower boundary on ROC chart will signal further fall in prices.

MACD - MACD tells the same story, contracting action around the zero line. If MACD starts moving below the zero line and sustaining then we are sure to see bigger falls in crude.

Sunday, October 21, 2012

Nifty, Sensex - Elliott Wave Update

Nifty Daily

Sensex Daily
Both Nifty and Sensex above have been consolidating near the lower boundary of the consolidation, not good for longs. We may see prices continuing the down move once the lower boundary is broken.

Saturday, October 20, 2012

USDINR - Elliott Wave Update

USDINR Hourly
USDINR broke out of a consolidation and gave a big move (notwithstanding my earlier post). And this move should continue for a while. Another consolidation seems to be emerging with lower boundary at 53.60. We may see another move up soon.
RSI as can be seen has remained above 40 for most part of this up move and consolidation. And if this move continues we should remain in the 60+ zone to see some accelerated moves, ahead (Thanks to @ranajayb for the RSI article, but whether my interpretation is correct or not, only time will tell). As soon as the longer EMA (Green Color) catches up with price, we should see another big move.