Thursday, July 25, 2013

Nifty - Elliott Wave Update

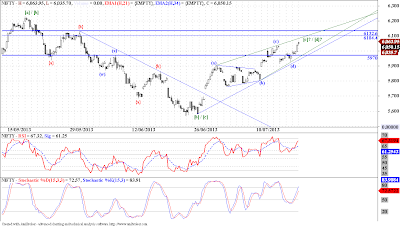
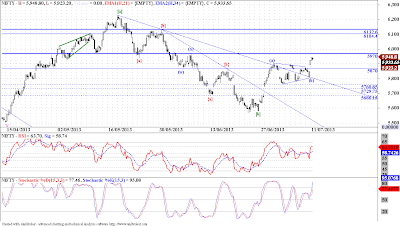
1. The rising wedge is violated, and the first pause may come around 5800 - 5775.
2. Below this levels we may see even lower values.
3. There are multiple possibilities developing in the market and I will cover the big picture this Saturday.
4. For the time being the trend is clearly down, and the intensity warns us against treating this fall as just another retracement to the preceding uptrend.

Monday, July 22, 2013

Banknifty - Technical Update

  1. There are some very interesting things happening on the Banknifty weekly chart above.
  2. First since the start of 2012, we have been rising faster and falling slower, which is a clear indication of the fact that the trend is higher.
  3. Every time the indicators reached the OS levels we got a nice move out of it.
  4. So far since 2012 we had never violated a pivot low, which has occurred just now, but again this has happened with larger time taken to fall than to rise.
  5. So by this token the trend is still up, and we are once again at the OS levels on the indicators.
  6. For traders this is a nice reward to risk setup, my personal opinion would be to buy at these levels with a  small stop below last pivot low, and target towards the 61.8% retracement level of the last fall.

Friday, July 19, 2013

Nifty - Elliott Wave Update

  1. A rising wedge can be spotted on the Nifty, with negative divergences and OB levels on the oscillators.
  2. All this indicate that the current up move is losing steam quite like the character of a rising wedge.
  3. Add to that the supply zone overhead and the upper wedge boundary, we may be very close to a short term top.
  4. I believe 5970 would be an ideal level, a closing below which will be a strong signal of an end to this up move.
  5. A close above 6230 however will change our medium term outlook, please refer my last post for a longer term outlook, here.

Saturday, July 13, 2013

Nifty - Elliott Wave Analysis

  1. Nifty staged a sharp rally in last couple of days, marked with important announcements overseas.
  2. The next pivot resistances are coming in around 6130 levels, that is another 100 points away from current levels.
  3. But will we get there, and complete a classic (a)-(b)-(c) correction, remains to be seen.
  4. Right now, I think we are at a critical resistance once again, and this time the levels are 6020-6030.
  5. One can get a clear idea by looking at the 2 hour chart below.
  1. This chart clearly shows we have closed above the 5970 mark, which in itself is bullish, but the next bout of selling is likely to come in the 6020-6030 area.
  2. If we can cross this area, then the next 100 points should come easily.
  1. On the longer term though there is a doubt between what is the correct wave structure that is playing out, I have given 2 most likely option according to my limited understanding of the EWP and Neowave Theory, right now there are no preferred count, both are equally likely.
  2. One count suggests, that the second X wave is still in progress, and is forming a triangle pattern. Which suggests we should find resistance soon and fall again to complete the triangle. Once this triangle is done, we should see the thrust out of the triangle.
  3. Other count suggests, that the second X wave was done at 5477.20. And the wave Z may be forming a triangle or an ED. In both cases we have another couple of wave pending before we see a final top in place.
  4. Both the possibilities above are presuming that our long term count of a big flat correction is correct, and will play out. 
  5. So far the conditions have not changed to make us alter the count, but should things change, we will be there to inform you about them.

Thursday, July 11, 2013

Nifty - Elliott Wave Update

  1. Nifty has been in a sideways consolidation for last few days, it actually formed a flag/pennant.
  2. We have a clear BO today. As we have been reiterating, the band of 5870-5970 was critical for any up move.
  3. Right now too 5970 is very important, above that level we may test 6030 - 6130 band.
  4. We have an (a)-(b)-(c) move on our hand, and wave (c) should be equal to wave (a), which comes around the 6100 mark approximately.
  5. SL for this trade would be the last pivot low, around 5800 with current price around 5940 and with probable target around 6130, we get a reward to risk ratio of approximately 2.
  6. Oscillators are in OB zone, but during trending moves, they can stay OB for a while.

Monday, July 08, 2013

Nifty - Elliott Wave Update

  1. Nifty has been trapped in a trading band of 5910 - 5760.
  2. The resistance zone pointed out in last post is providing supply.
  3. We need to take out 5970 - 5910 zone for this up move to continue.
  4. We have a support zone around 5760 - 5730, which should absorb any down shock to the market.
  5. But the key remains the supply zone overhead, which needs to be taken out.
  6. According to EWP, since we have a faster retracement, we can begin a new count, for a possible upmove, we may have wave (a) / (1) behind us already.
  7. The indicators are moving towards an OS zone, which should be a good area to buy, a retest of previous pivot low at 5760, would be ideal.

Wednesday, July 03, 2013

Nifty - Elliott Wave Update

  1. Resistance offered in the resistance zone identified.
  2. Now the big question whether the trend is changing from down to up or we have resumed the downtrend.
  3. The key support comes at 5686, if honored, we may see atleast another leg up, or a possible trend change.
  4. If we breakdown from 5686, we have more downsides left.

Tuesday, July 02, 2013

USDINR - Elliott Wave Update

  1. USDINR was rising in a rising wedge formation since the 2008 equity market crisis.
  2. The trend is unmistakable, and strong, but from price extremes come big moves. 
  3. We have a potential for one such scenario playing out, but one must tread cautiously, as the underlying trend can spring back to life without any warning.
  4. There was a fibo confluence zone around 62 to 60.40, and we seem to have found selling pressure here, indicate towards a pause.
  5. Oscillators are in OB zone.
  6. Classical EWP practitioners would feel confident of pattern completion as the pattern preceding the last up leg was a triangle, which according to classical EWP precedes last thrust in the trend.
  1. There is a broad support zone between 58.92 - 57.30.
  2. The current OB status on the oscillators suggest prices should recede a bit. MACD is showing negative divergence (not shown on the charts).
  3. Below 57.30 we may see the larger trend reversing.
  4. The long standing support TL on RSI, should give an early warning of a reversal if violated.

Monday, July 01, 2013

Nifty - Elliott Wave Update

  1. The triangle mentioned in the last post resolved upwards, which most likely suggests that the bottom, at least in the short term is in place.
  2. The important hurdle though lies between 5870 - 5970. Once through this band we should see even higher prices.
  3. This resistance band may cause a temporary pause in the markets, if the pattern of the pause is a 3 wave move, this should be used as an opportunity to add to longs or create new longs.
  4. 5680 odd level should provide good support to any correction, should prices reach there.
  5. The current OB condition on STS and RSI also concur with the "pause" theory.
  6. As long as 5680 is protected, any OS condition on the ST charts should be used to buy into Nifty.