 |
| Daily Chart |
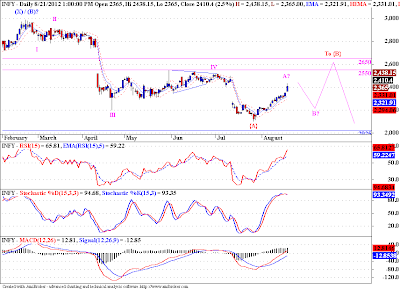
This is a daily chart of Infy. Please refer last post here, calling for a possible bottom. It looks like the bottom has indeed formed, the rise does look impulsive, so I have labelled it as wave A, and we can expect a zigzag in wave {B} here. Right now the stage looks set for some consolidation as both RSI and STS are well extended into the overbought zone. Also MACD is meandering around zero level. So we may see a 3 wave pull back from these levels, which can present a good short term trade to the long side., before we resume the wave {C} / {III}? of (X) / (C)?. The second case will be particularly severe.


No comments:
Post a Comment
...I am thrilled to learn what you think about this piece of content...