Monday, January 28, 2013

Stock Ideas


  1. On the weekly fractal, KST has crossed over into the bullish zone, above the neutral level. Generally signals higher prices.
  1. Both MFI and ROC seems to be forming long term basing structure.
  2. ROC gave a BO but came back into the range.
  3. MFI signals that, participation is rising on rallies and falling on corrections.
  4. A Falling TL break might just be the signal which was required to confirm an end to this prolonged correction. But now we need followup.
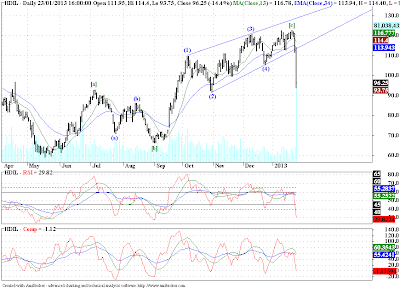
  1. An EW perspective on this counter suggests we may be in the 1-2/1-2 formation. The supporting evidence is RSI, is right in its Bull Support Zone. Now should RSI break down straight through this zone marked by dotted lines on the RSI panel, we may as well conclude that the correction is still not over.
  2. The second wave (2) may not have completed yet, and also this count is not definitive. There is a possibility that this 1-2/1-2 might just turn out to be an A-B-C.
  3. In that case, what we are considering to be a second wave of one smaller degree, may just be the start of a long down move, following a completion of a 3 wave corrective rally.
  4. So though the picture is exciting for the bulls it might be a good idea to wait for all the pieces to fall in place, before initiating a trade.
  1. Prices seems to be contracting (courtesy Bollinger Bands).
  2. MFI suggests a dramatic fall in participation with a steep decline, but prices have staged a 3 wave corrective rally at the same time. Overall this might be construed as bullish.
  3. ROC as obliged the price and is falling, after getting resisted under a rising TL.
  4. Now the BO from the new falling TL may give us an advance signal of a possible resumption of this up move. If supported by a rise in participation (a.k.a a BO above the falling TL in MFI), would add that much more credibility to bullish scenario.
  1. RSI broke out above a falling TL. But prices "HAVE NOT" confirmed the same. 
  2. Prices should BO above falling TL, to confirm the signal given by RSI.
  1. Again prices are contracting, as shown by the Bollinger Bands.
  2. MFI is rising with firm prices and falling with falling prices. 
  3. ROC and MFI have formed positive divergences.
  4. All signs of higher prices. If confirmed by prices, if they trade above the EMA of the Bollinger Bands.
  1. Now the final nail in the coffin. An Inverse HnS, "MAY" be forming. Clearly if prices trade below the low marked by H, this scenario is negated.
  2. But in strong support to this scenario is the RSI TL, which has been tested 4 times , and if respected should result in an up move in prices. (Though the fractal is a small one only 10 min).
  3. KST is making higher highs and higher lows.
  1. ROC has formed a base just below the neutral level. If we get a BO this could be bullish in the very near term.
  2. But his near term strength may help us stage a BO from the HnS NL, and to ring in more buyers.
Note: This is not a trading recommendation. Just an example how I  try to use the "weight of evidence" method. Suggestions and criticisms (constructive only) are welcome.

Thursday, January 24, 2013

Stock Ideas

  1. HDIL seems to have completed a 3 wave counter trend move, as is obvious from the sharp fall, once the final rising wedge (ending diagonal) was complete. Any 3 wave bounce should be sold into, I guess.
  2. The breakdown has reached its target (target for the ending diagonal wave (2) low) in practically 2 days, that is sign that the prevailing down trend has asserted itself, and how.
  1. M&M on the other hand has been trending beautifully. But as with everything else, all good things must come to an end.
  2. Whether M&M has completed its 5 wave advance at 975 odd levels, only time will tell, but it could well be the time to be cautious. 
  3. The best strategy would be to watch the price moves closely, if we rally in 3 waves and fall back to make new lows, the trend could be considered bearish for some time to come. The whole advance from 620 odd levels, stands to be corrected.
  4. There is also a possibility that the correction might be a shallow one (look for the wave (4) of one lower degree to offer support), and the last of the advance the final wave [5] might still be pending.
Note: This discussion was in response to a direct query from a Blog Reader. Thought everyone might find something useful out of it. Just a thought!

Tuesday, January 22, 2013

Nifty - Elliott Wave Update

  1. I have labeled the tentative EW count on the chart above. I feel we are close to wave [3] top. That is the most likely count at this stage.
  2. But there is a likelihood of a final dash to 6168-6188 band, where there is another confluence zone which might end the wave [3].
  3. RSI is showing a negative divergence, also we have a rising trend line which has offered good support to this up move. The only place where we have a breach of this TL is when we were forming wave (4) of [3] (that is typical of 4th waves). We may get another break of this rising TL during wave [4]. 
  4. This wave [4] may target the area of previous wave (4), that's just basic EW guidelines.
  1. This chart shows ROC indicator, which is also showing persistent negative divergence. This rising trend was supported by a rising TL, which can also be seen as a neckline for a HnS on ROC.
  2. The channel drawn is a slightly different, the lower channel boundary, should be breached to signal and end of wave [4], given that wave [3] is done, else the channel will have to be redrawn.

Thursday, January 10, 2013

Stock Ideas

  1. Allahabad Bank broke out of an obvious HnS. The target for HnS is 189.50.
  2. We have some head room to go, and a flag is developing on the chart, a BO from flag should provide a good entry.
  3. The BO may target 189.50 for starters with a possibility for exceeding that level. SL below the lowes point of the flag.
  1. Andhra Bank is in a similar position.
  2. The target for HnS comes around 145.20, with a flag forming on the chart. A BO would be a great place to jump on the train.
  3. SL below the extreme of the flag.
  1. Central Bank has formed my pet pattern an F. We now need a BO from this F, the target for the earlier BO from a HnS was around 100.
  2. SL for the BO from F should be kept below the extreme of the flag.
  1. Corporation Bank looks good for a flag, a small consolidation to this up trend. The target for the HnS comes around 490, and the stock is bang on target.
  2. Those who are already long this counter, should use this consolidation to exit.
  3. But a BO from the flag may give a tradable move. Trade this one with caution, stocks discussed before this one are preferred.
  4. If the BO trade is taken SL should be kept below the Flag extreme.
Note: These are continuation trades. The trades will be taken only when we get a good high volume BO from the flag patterns. A flag pattern is not very precise, a trader may need experience and may need to exercise his judgement while taking the trade. I have only pointed out high probability patterns to enter into an existing trend.

Crudeoil - Elliott Wave Update

  1. We had pointed out the diamond formation in Crude refer chart here. Also the possibility of a rally to test the upper boundary of the diamond formation (which we got, BO from possible HnS). Well the view is still valid, but we need to monitor any fresh developments to place ourselves in a possible change of trend, before others and with as little capital exposure as possible.
  2. We have a possibility of one such pattern developing currently on Crude chart above. We have found some resistance bang in the middle of the resistance zone of 5125-5225, and are turning down from there.
  3. At such resistance clusters, bar patterns which are notorious for giving false signals, hit the nail on the head. If this week closes down, that is if the close is below the open of 5120, we could have  potential turning point on our hand (a reversal day), I prefer to short right into the close such a pattern to be very sure that the pattern that is identified is correct. With a SL above the recent high of 5169.
  4. If 5169 indeed turns out to be a top, we have a minimum target for expected down leg around 4305, that is a decent move (don't forget we are tracking weekly fractal), with the expected down leg equal to the one preceding the correction.
  5. But a caveat, this wave count is not carved in stone, and neither the view expressed by the author of this post. I may turn out to be a complete fool, and I often do in this uncertain environment, but the risk reward is skewed in the favor of the sellers, and that is enough most of the times.

Thursday, January 03, 2013

Dow Jones - Elliott Wave Update

  1. I did a post on DJI earlier last year, refer it here. I was counting a DZZ in DJI, and was expecting another [a]-[b]-[c]. And it seems we are getting it as of now.
  2. An interesting pattern to spot is the wave [b] triangle in wave W. A similar triangle seems to have formed in wave [b] of Y. Yesterdays sharp up move may have signaled its completion.
  3. What now then, well as envisaged earlier this year, a move up in wave [c] of Y.
  4. The pattern is beautiful, and playing fair as well. I would not like to spoil the discussion by including targets and transform it into a forecast. 
  5. Right now I just want to enjoy the feeling of a great pattern unfolding in almost a copy book style.
  6. A caveat, as usual, any trading activity below the low of wave (c) of [b] of Y on above chart, should bring us back to the drawing board. Till then Enjoy!

Wednesday, January 02, 2013

Gold - Elliott Wave Update

  1. Gold was rising laboriously making overlapping wave structure. I am counting this structure as an ascending triangle, ending as shown on the chart.
  2. Since the completion of the ascending triangle pattern, we have rallied in 5 waves in wave [1], and also seem to have completed a corrective flat pattern, in wave [2].
  3. If our pattern identification is correct, we may see Gold rising in a probable wave [3].
  4. Composite has formed a positive divergence with prices as well as RSI.
  1. On the daily chart, we can see that we have ended the wave (c) with a possible triangle in wave {5} of (c) of [2].
  2. Composite has formed positive divergence with prices as well as RSI.
  3. At this point the Reward to Risk is quite favorable, and with a small risk we can enter a position with big potential for gain in near future. For a min wave [3] == [1], we get a target of 33900, and @ 161.8% of wave [1], the target for wave [3] comes at 35900 odd levels. SL should be kept below 30600. Yesterday's close was at 30888.