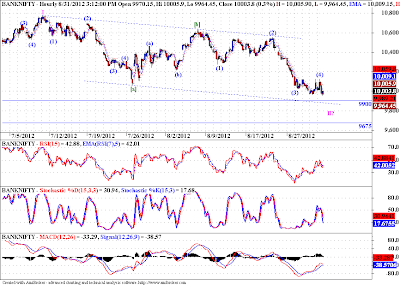
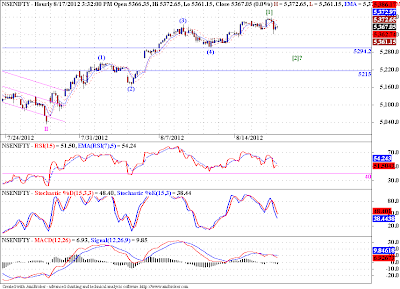
Friday, August 31, 2012

Banknifty - Elliott Wave Update

Hourly Chart
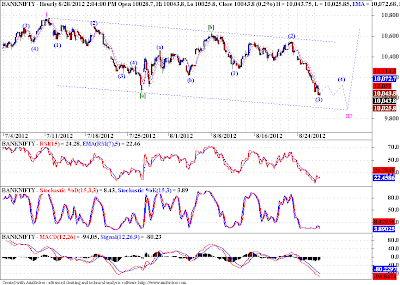
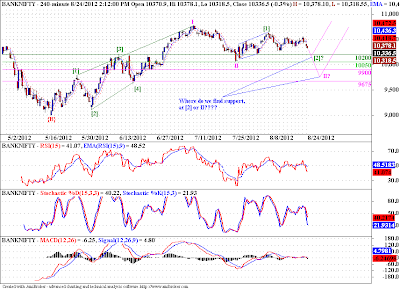
Banknifty is approaching the PRA (Possible Reversal Area) between 9900-9675. We are looking good to complete a clear 5 wave structure too. Will this index turn up from this PRA. Well we can use channeling technique on this zigzag correction in wave II, and we get the lower channel boundary in the same PSA. If we bounce off the lower channel boundary, then we may have a potential reversal at hand.
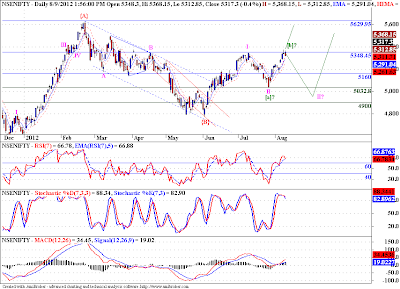
Nifty - Elliott Wave Update

4 Hourly Chart
Nifty is bang in the middle of the support zone. Whats in store for us, only time will tell. But the risk reward scenario for a possible up move from this zone is getting favorable. Below 5215-5200 levels, the long trade will start losing credibility. And to go short we will first require a clear 3 wave pullback to this down move. The reason I am in favor of long trade (till we don't break the said support zone) is because the current fall resembles the fall marked by wave II on the chart above, and it has been observed that alternation is conspicuously missing in waves II and IV of an ending diagonal.
But one cant argue with the markets, and contrary to the expectations of "certainty" fascinated market participants, we have to be ready for adverse market action. Hence the "alternate count" (discussed in last post), which is as good as a "boon" given by EWP to traders.

USDINR - Elliott Wave Update

Hourly Chart
A flag like formation on USDINR can be seen on the hourly chart above. We need to break out from the above consolidation to start the wave (3) of [5] as per my preferred count. Other possible scenarios were discussed in yesterday's post.

Thursday, August 30, 2012

USDINR - Elliott Wave Analysis

4 Hourly Chart
This is a 4 hourly chart of USDINR. Again this chart throws at us multiple possibilities. My preferred count is bullish on dollar. Two of three probable counts are bullish, one is bearish. The invalidation of the bearish count is above 56, whereas invalidation for bullish counts is below 55. All levels are for spot USDINR. 
One of the bullish count suggests we may rise till 56.75 in wave (b)?? and then come down in wave (c)?? of [4]??.
Bearish count suggests that we have completed a triangle pattern in wave (b)? and should not come down in waves (c)? of [4]?.
Lastly the preferred count suggests that we have completed triangle in wave [4] and are now rising in wave [5]. We may have completed waves (1)-(2) of [5].

Preferred count - Wave label not followed by anything.
Alternate count I - Wave label followed by ?.
Alternate count II - Wave label followed by ??.

Note: Some readers have a problem with my analysis. The argument is that the "discussion of multiple possibilities in a market tends to be confusing and does not add value". I would like to say, I am just discussing probabilities here, it may sound defensive to some, but its the truth. I have a trading method as everyone who is dabbling in market is expected to have. I use EWP to become aware of different probable scenarios in the markets, and then trade the one which gives me highest "expectation" using my trading method. Now as with many people around me, this concept may be a little hard to digest, or may be plain wrong, for the readers, but I cant help it. If  I sound confusing, then may be I am, but it is preventing me from losing money in the market, I would take that bet any day!

Nifty - Elliott Wave Analysis

4 Hourly Chart
This count includes another possibility, in which we have already completed wave III of {C}. And right now falling in wave IV of {C}. The pattern is same, that of an ending diagonal, so far. We may rise from the support zone mentioned earlier between 5295-5215. And head towards 5630 levels. However one rule of EWP might come into play, if we start rising from here, and will be of great help. The rule is 3rd wave of a motive wave is never the shortest. In our case wave III is shorter that wave I, so to satisfy the EWP rule stated above, wave V cannot be longer than wave III. Once we establish wave IV low, we can ten pinpoint exact level, above which this wave V cannot go. If at all it goes above that level, we can expect even higher prices in Nifty. In the daily chart below, we can see if prices do turn from the support zone mentioned above, 5630 may be within the reach of possible wave V.
Daily Chart
As always I am sharing an alternate scenario as well, shown in weekly chart below. In this scenario, if we do fall below the support zone, mentioned above. We have to be ready with a plausible scenario, and that scenario was highlighted earlier on this blog, that of a triangle in wave {B}.  We may continue with prices consolidating in even narrower range. The breakout from this narrowing consolidation will clear the further trend in this market, my bet is up, still.
Weekly Chart
Note: Some readers have a problem with my analysis. The argument is that the "discussion of multiple possibilities in a market tends to be confusing and does not add value". I would like to say, I am just discussing probabilities here, it may sound defensive to some, but its the truth. I have a trading method as everyone who is dabbling in market is expected to have. I use EWP to become aware of different probable scenarios in the markets, and then trade the one which gives me highest "expectation" using my trading method. Now as with many people around me, this concept may be a little hard to digest, or may be plain wrong, for the readers, but I cant help it. If  I sound confusing, then may be I am, but it is preventing me from losing money in the market, I would take that bet any day!

Tuesday, August 28, 2012

Banknifty, has some more downside left!

Hourly Chart
Banknifty is tanking towards the support zone pointed by us. This move is expected to be an impulse. We may get some consolidation here, and then take the last plunge towards the target zone marked in pink on the chart below.
4 Hourly Chart

Life is rarely so simple with Nifty!

Daily Chart
Nifty is following the possibility of an ending diagonal in Nifty, pretty tightly. But life is rarely so simple with Nifty. For this corrective move we are currently in, the target or possible reversal area to the upside lies between 295-215. 
Prechter once likened EWP to a road map. And that is precisely what we should use it as. There are may roads to a destination, but we can select only one path at a time. EWP helps us choose the most likely one, and at the same time, if we run into trouble on that path, also gives us the next best option. Now I couldn't ask more of my navigator, what about you?

Monday, August 27, 2012

USDINR found some support around 55 levels!

4 Hourly Chart
I had proposed three possible outcomes from this range bound action on USDINR. I feel if we take out 55.92, we might well be on our way to play out the possibility shown on the chart above. Which means we have to take out the top of wave [3] around 57 odd levels, as our minimum target for wave [5]. On the other had if we get resisted around the 55.92 levels, then we may see prices going down to much lower levels, two possibilities were marked on the chart in our last post, refer it here.. We are still in the range of 55.92-55.00, so unless we get a break on the either side, we wont see a price expansion.

Saturday, August 25, 2012

Infy Elliott Wave analysis, on three different fractals!

Monthly Chart
This is a monthly chart of Infy. One can easily spot a clear 5 wave move on it. If we consider this count as valid, then the correction to this up move should bring the prices back to the area of the previous wave (IV), preferably to the area around the terminus of the wave (IV). The probable range is marked between 1200-900, which may sound far fetched at this point in time, but it is what EWP tells us.
Weekly Chart
So considering the possible pattern development in the monthly chart and its price implications, we cannot count the current  three wave down move as complete. I believe that we are in wave {II} of (C) of this corrective pattern, and we have much more downside left in this stock. Also the most dynamic part of any down trend the wave {III} of (C) is yet to come. And that is what will separate the men from the boys. The wave A of {B}? has been very strong so far, and that may not be completely out of the line. But I feel it is still a part of a corrective pattern.
Daily Chart
The daily chart shows a clear 5 wave decline, and since it looks complete, we were right in expecting a corrective rally. We get a good fibo cluster between 2550-2650 range. 
But being an EWP practitioner, and seriously influenced by thought process proposed by Sir Karl Raimund Popper, I cannot take this analysis of mine too seriously, and should always be prepared for an alternative scenario. Since the minimum requirement of a zigzag correction has been satisfied, as seen in the weekly chart above, we may see as well see a start to a new up move from these levels. And hence my preferred trading action would be to buy any clear 3 wave counter trend move to this sharp rise, to play the wave C? of {B}? or if this alternate scenario plays out to play the 3rd wave.

Friday, August 24, 2012

Correction continues in Banknifty!

4 Hourly Chart
What will happen in Banknifty? Where will this current weakness take the prices? There are two bands, one green and other pink. Green band ranges from 10200-10050, and the pink one ranges from 9900-9675. Both these possibilities are bullish though. However if we break below the lower level of the pink band, this bullish scenario will come under scrutiny.

Wednesday, August 22, 2012

India Banks, short term strength on "Cards"!


Banknifty Weekly
Banknifty is in a corrective rally. We are expecting wave III of {C}, but somehow Banknifty is not rising. If we look at the charts of some private banks below, we can see they are rising as the patterns unfold, but the reason for Banknifty's consolidation is the sharp fall in some of the PSU banks (Charts attached below). This sharp fall is preventing Banknifty from rising, but now it seems that we may have formed at least a short term bottom in these PSU banks. Now PSU banks may as well rise along with the private banks. This will surely help the cause of Banknifty as well as Nifty. But be mindful of the fact that, we may be in the last rally of an important corrective pattern.
HDFC Bank Weekly
HDFC Bank may be rising in wave III of {V}.  
HDFC Weekly
HDFC is breaking out a long consolidation in wave {IV}, the consolidation has formed a triangle pattern, typical of 4th waves.
ICICI Bank Weekly
ICICI Bank has formed a clear impulse down as wave {I}, and is now forming wave {II}. The pattern that is forming is a zigzag, typical of 2nd waves.
 
SBIN Weekly
SBIN too completed a clear impulse down in {I}, and now correcting it with a possible zigzag, but the wave B of the zigzag may e forming a triangle pattern.
Bankindia Weekly
Bank of India seems to have completed an expanding ending diagonal pattern in wave V of {I}, we may see a corrective pattern now, possibly a zigzag, to correct this impulsive down move in wave {II}.

Note: EWP is a creative faculty, and not subject to mechanization in its original form. But this does not mean that there is a lack of objectivity to it. This is an attempt at forecasting the future course of action of Indian Stock Markets, perhaps, the most influential of the sectors. Though Forecasting is not a healthy habit for a trader, for an analyst such excursions should be allowed to release the creative tension, which sometimes builds due to excessive objectivity. All great achievements started with a dream, and this is one of mine. One last attempt to lure the blindfolded, before the culling begins!

USDINR indecision continues!

4 Hourly Chart
USDINR as pointed out in our last post is still indecisive, more than a couple of possibilities exists, but the range has now narrowed down to between, 55.92-55.065. A break below the 55.065 level should be good for equities, and conversely a break above the 55.92 levels may suggest some weakness.
An interesting thing to note here is that below 55.065 levels, the possibility of a triangle in wave [4] takes a backseat, it will be postponed to say the least. But if we move up without violating 55.065 and break above the 55.92 levels, the up trend is almost confirmed. If the up move persists after breaking out from 55.92 level, we may even see prices reaching 58-60 range.

Tuesday, August 21, 2012

Infy is in a corrective bounce!

Daily Chart
This is a daily chart of Infy. Please refer last post here, calling for a possible bottom. It looks like the bottom has indeed formed, the rise does look impulsive, so I have labelled it as wave A, and we can expect a zigzag in wave {B} here. Right now the stage looks set for some consolidation as both RSI and STS are well extended into the overbought zone. Also MACD is meandering around zero level. So we may see a 3 wave pull back from these levels, which can present a good short term trade to the long side., before we resume the wave {C} / {III}? of (X) / (C)?. The second case will be particularly severe.

"Caveat Emptor", Crudeoil Buyers!

Daily Chart
We had discussed a possible 1-2/1-2 scenario for Crudeoil in our last post, refer it here. But I sense another possibility here. One in which the wave (5) of [5] being extended. In that case we may already be in the last wave of this wave [5], and hence of this long term pattern, forming since early 2009. If it is so, I need not tell you again, of the potency of the bear market that will follow. So we may still be in a third wave extension, but this possibility cannot be ignored. The target zone for this wave (5) of [5] ranges between 5500-5650. If we reach this area I would be "extremely cautious", to say the least, about the further potential of this up trend.

So far so Good, for Nifty!

Hourly Chart
Nifty has so far continued on its path as envisioned by us earlier. But since we can spot a clear 5 wave structure on the chart, we should at least think about protecting our gains. I am expecting a fall towards 5295-15 levels on Nifty in wave [2]. Accordingly, we should protect our gains. I would keep a SL of 5340, and would reenter if one of the following two cases play out,
A) Prices take out the SL and then immediately move back up and take out the recent high above 5400. I that case I would buy the breakout above 5400.
B) Prices hit the SL and drift down towards the 5295-15 band. I would take a long position if prices complete a clear and satisfactory 3 wave move towards the 5295-15 price band. SL for this new long position would depend on the the exact price pattern that will form.
Apart from the above two possibilities, we may straightaway move up from current levels, and that would mean that our earlier 1-2/1-2 scenario is playing out, and should result in a swift move heading towards the 5630 levels. 
I would be skeptical of any chance of up move if we fall below 5165 levels on Nifty.

Saturday, August 18, 2012

Possible Ending Diagonal pattern in Nifty!

Daily Chart
This is another possibility for Nifty, that of an ending diagonal in wave {C} of (B). Right now this is just a wild conjecture to let out the craving for predicting the future, only time will confirm. This view is not in any way the basis for my trading actions as yet.

Nifty is rising in 5 waves and falling in 3!

Hourly Chart
This is an hourly chart of Nifty. We can see a clear 5 wave move on Nifty. Earlier I had marked 1-2/1-2 wave structure, implying a sharp burst of prices upwards in wave (3) of [3] of III, please refer the chart here. Though that possibility is still possible, we have to be prepared for alternative outcomes. I have labelled the above chart as a possible wave [1] of III, which means we may slide down to form wave [2], towards the 5295-5215 levels. For the earlier scenario of a 1-2/1-2 to play out we should stay above 5350 levels. If we drift below 5350, this second possibility of wave [2] may come to fore.

Friday, August 17, 2012

Crudeoil headed to conquer wave [3] top around 5500 levels!

Crudeoil / INR on its way, as discussed previously. We may be in the wave [5], the last one of this long forming up move. The minimum target for this upmove is the top of wave [3]. After that one has to be very very cautious, if on the long side.
Caveat: Commodities sport of 5th wave extensions, but looking at the length of wave [3] and the size of wave [4], we can expect that wave [5] will be normal.

USDINR, the "Grind" continues!

Chart 1
This is my working count (Chart 1) so far. It will be, till we take out the top marked at (b). But there are a couple of different possibilities, marked on the charts below. Both the possibilities below are that of possible triangles, but in different waves. The details are discussed below.
Chart 2
This chart (Chart 2) shows a possible triangle in wave {b} of (b). Which means that once it is complete we will have a thrust from the triangle up wards, in wave {c} of (b). Once this wave (b) is done, we should come down, to complete wave (c).
Another way to count the price action is shown below (Chart 3). Here we may be forming a triangle in wave [4] itself, and may be pretty close to completing it. We have to come down a little in wave (e) of [4] before we embark on a thrust from the triangle in wave [5].
Chart 3
So in conclusion, we have two of three counts (Charts 2 and 3) suggesting an up move once the respective triangles are complete, whereas one count (Chart 1) suggesting immediate down move from current levels. The real question however is, how we trade this info at hand? I would share what I would do in such a scenario. Both the triangle scenarios shown above would get violated below 55.065, so as long as this level is protected, the triangle scenarios are possible. I will wait till 55.065 is taken out to initiate short positions, and keep stop loss for earlier short positions at 56.35. To initiate a long position I would wait for the market to come near the lower trend line of the triangles around 55.35-55.25 levels, and then keep a stop loss and reverse of 55.065, to play from the short side if the triangle scenarios are violated.

Thursday, August 16, 2012

Hardlanding of China's economy evident from the chart of Shanghai Index!

This is chart for Shanghai Index. We may have put in an important top around 2008. There are a couple of possibilities, which are duly marked on the chart. Following the top in this index, we have fallen hard and completed wave (A) and (B) already. The development following wave (B) is very interesting. Prices have formed a series of 1-2/1-2 waves, and we may be just be in the process of accelerating downwards, the minimum target would be the low of wave (A), and ideally should target the terminal point of wave (IV), which comes around 1000 levels, this may happen if we breakdown below the wave (A) terminus.

Tata Motors is in a corrective bounce!

Daily Chart
Tata Motors  is past an important top around 320. From 320 we have fallen in clear 5 wave formation down to 200 odd levels. Now since the 5 wave down move is complete, we should look for a corrective bounce. I think we should eventually test the levels between 260-75 on Tata Motors, before resuming the downtrend. Nifty is displaying strength, and that strength will rub off on all the counters including Tata Motors. We should move up in a zigzag fashion, and oce the move on Nifty is done, Tata Motors will come down in the earnest.
Weekly Chart


Tuesday, August 14, 2012

Nifty may move sharply, who told you first, EWP or TA?

Weekly Chart
I wonder how certain potent indicator patterns crop up just at the right moment. For instance take the "hook" which has formed on MACD, marked by the oval on the above chart. This pattern indicate possibility of dynamic movement in a short time frame. Also this pattern has aligned when we are expecting a 3rd wave in Nifty. So the question remains, not in my mind though, is EWP a method which gives a peek into the future. I believe so, what about you?

Petronet continues its unmistakable trend, but for how long?

Weekly Chart
This is a weekly chart of Petronet, we can see a clear trend in the scrip.I have tried to label the chart according to EWP. I think we may be in the last wave of this up move so far, unless we are still in the extending third wave. Still if our count is correct we may see prices exploding soon. We may be forming a series of 1-2/1-2 waves, as can be seen from the daily chart below, but for this pattern to play out, we must breakout from the rising blue channel asap. If we get resisted here, we may not have yet completed the wave {IV} correction, n that case we may see lower prices in coming days. But both these possibilities don't have much time left, eithr of them should play out, sooner than later. 
My personal choice of trade on Petronet would be a long on the breakout from the rising channel, with a stop loss below 139.25, which is the latest pivot low. I would target minimum 180 the high of wave {III}, and prices may even touch 220-240 range if supported by strong markets.
Daily Chart

Monday, August 13, 2012

SBIN may be nearing a short term bottom!

Weekly Chart
This is a weekly chart of SBIN. I have two possible counts for SBIN, one is bullish for medium term but bearish after that, and other is consolidation for the medium term and then bearish afterwards. I prefer the second one, the reason is the results that SBIN posted recently. I must admit that I am not an expert on the fundamental analysis side. But I do feel that the NPAs of PSU banks are going to soar, and that should be a cause of concern in coming days. I am sure we are going down, as the broad market is developing such a pattern, but whether SBIN will participate in the wave {C} of (B) rally on Nifty is not clear yet.
On the short term though, we may look for buying opportunities in the 1800-1750 zone. In either of the above two scenarios I am looking for a short term bottom in the range mentioned above. I would not hold any of this stock below 1570 though. Please refer the daily chart below for short term count.
Daily Chart

Look for support in 450-430 range on Ranbaxy!

Weekly Chart
This is a weekly chart of Ranbaxy. I am trying to count a 3-3-5 corrective pattern, a flat, possibly an expanded flat. Right now, on a smaller fractal though, we may be forming wave {B} of  (B). We may find support between 453-433 levels. Although minimum requirement for this correction is for prices to test 470 levels. As shown in the chart below once we finish the wave C of {B}, we may rise to form wave {C} of (B). But that is some time away for now. I plan to wait for wave {B} to complete and market to give me a signal that it is indeed looking at higher prices. 
Our last post on Ranbaxy was looking for a W-X-Y type correction, but obviously prices had something else in mind. Prices did fall as we expected but since the pattern that was forming was different, the ensuing price action was different. But since we have not yet broken down 445-25 range we may expect prices to scale 570, and may trade even higher.
Daily Chart

Saturday, August 11, 2012

ITC in the last leg of a strong advance!

Weekly Chart
ITC weekly chart shows a clear impulsive trend, and there is still some upside left. The chart above shows that we may be in the last leg of this advance, in wave {V}. Once this is done, we will retrace a 5 wave move on a very large fractal. The daily chart below shows, a possible resistance around 280, where we are expecting wave III of {V} to end. We may consolidate a while before embarking on the final wave V of {V} of (V). The target for that wave comes around 330. So we may be headed for 330 with a pause at 280 levels before possibly the last rally in this impulse.
Daily Chart

Friday, August 10, 2012

Nifty hits "resistance", and USDINR finds "support"!

Nifty Hourly Chart
This is not an attempt to exemplify the correlation between USDINR and Nifty, but just an observation I am sharing here. I am currently counting a I-II/[1]-[2]/(1)-(2) formation on the chart of Nifty, I am expecting Nifty to breakout from the resistance zone around 5340-50 and rally handsomely towards the 5630 level. On the other hand USDINR, has found some support in the 55.00-55.10 zone. We may see prices touching the 55.60-55.70 zone to complete the wave 2 on the chart below. In USDINR too we have a {1}-{2}/1-2 formation going on, but in exact opposite direction of Nifty. Though we cannot entirely bank on this inverse correlation between Nifty and USDINR, marking waves on charts of both the tickers, indeed help us in better classifying the waves. So right now I am hoping Nifty would resume the up move and USDINR its down move, sooner than later. I would become skeptical of these respective moves, if Nifty trades below 5280-70 band, and USDINR trades above the 55.60-55.70 band, till such time the existing count is intact.

USDINR Hourly Chart

Thursday, August 09, 2012

Nifty - Elliott Wave Analysis

Daily Chart
Nifty is faltering at the 5350 level. That is not good. We may fall to 5310-5290 range, where we should find support if this up move is to continue. An alternate count of a flat correction in wave II is marked on the chart. It is possible that we may see prices coming back all the way to 5030 level, before the wave III starts. So I am looking for prices to close below 5310-5290 range to at least get out of my longs for the time being, and also enter shorts below 5270-60 range, with a target of around 5030. Stop loss for this short trade if triggered, will be above 5375. We get a possible reward of 330 points with a risk of 115 points, that is a reward to risk ratio of roughly 3:1. I would take that bet. The overbought STS and RSI, may come in handy if we indeed fall below 5270-60 band.
Right now though I am bullish on Nifty till Nifty trades below 5310-5290 band. If this band is violated on the downside, I will start tracking my alternate count.

Bharti - Elliott Wave Analysis

Weekly Chart
This is a weekly chart of Bharti. Please refer to our last post on Bharti here. We were counting a triangle in wave (IV). But it seems we have already completed a clear 5 wave sequence on a much bigger fractal since 2003 (Please refer monthly chart below).  The invalidation point for the triangle count was around 250, if we break below it we will see much lower prices in coming days. The question to ask here is, what will happen if this triangle pattern is invalidated? And the answer is an (A)-(B)-(C) type correction, a 3-3-5 pattern, of which we will form the last wave, a 5 wave decline in wave (C). I have tried to mark the waves on the chart above, and as you can see, if we break below 250 the next chance for a support, although very slim, is at 220. Below that the next plausible support comes at 160-150 range. I would say, below 250-220 any hopes for a rally will have to be relinquished to the bears. 
Monthly Chart
Note: This chart also constitutes a great example of how EWP helps us even if we are wrong. Our expectation of a triangle, though yet to be invalidated, seems to be under serious scrutiny by the market itself. So by applying EWP rules and guidelines we can chart out next best count, and adjust our trading actions according to it.

Wednesday, August 08, 2012

Reliance - Elliott Wave Analysis

Weekly Chart
This is a weekly chart of Reliance. I have marked a couple of possibilities on it. One is quite bullish in near term, the other not so much. But in the long term both are bearish for sure.
The count marked in blue lines, shows an A-B-C move in wave {B}. If this count plays out, we may see Reliance rising over 1270 odd levels at a minimum, and may even touch 1475. But at this point in time it looks a bit too optimistic, but no one can argue with the market.
Second count marked in green lines, calls for a triangle in wave {B}, with wave B of {B} taking an inordinate amount of time. In this case, Reliance may find resistance in the 970-1040 range, and then come down in wave D of {B} wave triangle. So in the near term I feel Reliance may edge up, if it takes out the 970-1040 resistance band, and preferably the 1125 level, we may even see 1270-1475 range on Reliance.
Once again we are tracking the weekly fractal, so take your time before jumping in, referring the lower fractals for further cues could be a better idea.

Dollar Index - Elliott Wave Analysis

Bullish View
Please refer our earlier post on Dollar Index. It was published in Jan 2012. I tried to mark both bullish and bearish counts on DI. Right now we are critically poised between the two possibilities. The reason for this is, we have completed clear 3 wave move from the bottom formed in DI in first half of 2011 between 73-72 levels. Now as per our bearish counts below we may have completed the last wave E of {B} of the long forming triangle and may just be ready to move down, in a thrust from the triangle. This will cause DI to move much lower from current levels, please enlighten me with economic implications in this case. Alternatively, bullish count on DI, lends itself to a I-II/[1]-[2] wave count, now as bearish as the chart below is, this count is equally bullish. All depends upon how DI performs in the near term. If this current fall in DI is arrested around 81.50-81.00 levels, and the up move resumes above the 84-85 levels, we may be pretty sure that the bullish count is in play. But if this fall continues below 79-78 zone, the bearish count will take precedence.
Again this analysis is on a very large fractal, so patterns may take considerable time to form. But till we cross either 84-85 band on the upside, or 79-78 band on the downside, the bets should be kept small and for short durations only.
Bearish View