 |
| Daily Chart |
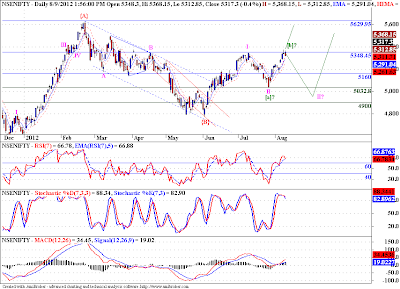
Nifty is faltering at the 5350 level. That is not good. We may fall to 5310-5290 range, where we should find support if this up move is to continue. An alternate count of a flat correction in wave II is marked on the chart. It is possible that we may see prices coming back all the way to 5030 level, before the wave III starts. So I am looking for prices to close below 5310-5290 range to at least get out of my longs for the time being, and also enter shorts below 5270-60 range, with a target of around 5030. Stop loss for this short trade if triggered, will be above 5375. We get a possible reward of 330 points with a risk of 115 points, that is a reward to risk ratio of roughly 3:1. I would take that bet. The overbought STS and RSI, may come in handy if we indeed fall below 5270-60 band.
Right now though I am bullish on Nifty till Nifty trades below 5310-5290 band. If this band is violated on the downside, I will start tracking my alternate count.


barobar lihile ahes !
ReplyDeleteWkHiEMA @ 5284 & Gap @ 5260 will offer support
This market is a buy on dips to 5284 wid SL @ 5260
See my last weekned wave count once... Extnd 5th of Y.a may be coming true :-)
cheers
Kindly provide a link to your post or blog.
Delete@ Aniruddha..
ReplyDelete5286 Offers Strong Support Any move below that will indicate 3-3-5.. Else its Moving Up..
@Shriram.. Please provide link for your Wave Count....
I agree.
DeleteThis comment has been removed by the author.
ReplyDeleteDear Aniruddha: chart is the same as was posted on ur FB wall :-)
ReplyDelete@ harsh:
Looking @ the move from 6339 as a DZZ, within that X from 4728 in play as another ABC-X-ABC
W.A 6339 5178 -1161
W.B 5178 5944 766 -66%
W.C 5944 4728 -1216 105%
X.w 4728 5630 902
X.x 5630 4770 -860 -95%
And , X.y UPWARDS from 4770 may be playing out as yet another smaller DZZ !!
X.y 4770 5377 607 in play *
X.y.W 4770 5348 578
X.y.X 5348 5033 -315 -54%
Currently , we may be in the " Y " leg of X.y from 5033, which itself will be a 3wave (ZZ looks likely @ present) ...
X.y.Y.a.1 5033 5150 117
X.y.Y.a.2 5150 5078 -72 -62%
X.y.Y.a.3 5078 5218 140 120%
X.y.Y.a.4 5218 5154 -64 -46%
X.y.Y.a.5 5154 5377 223 191% in play *
Think bout this one :-)
Dear shriram
DeleteI think your analysis of market being in a corrective rally is correct. I feel the minimum requirement for the third wave of this correction should be 5630. As far as your analysis is concerned you can help us a great deal by labelling a chart with ur count.
Regards
Aniruddha