 |
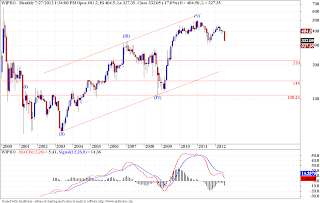
| Monthly |
This is the monthly chart for Wipro, I am doing this on a request. As discussed previously in the post on Infy, i am looking at big correction in Wipro as well. The monthly chart marks possible target area for this correction, which is way down from current levels, and the lowest point lies at the 2008 low. So if Prechter is correct about the deflationary depression in US, and the US dollar rising to much higher levels, resulting in severe bear market in US equities and almost every other equity market round the globe, our market will fall in line as well. And scrips like Infy, Wipro, SBI, etc will be the leaders of the mayhem.
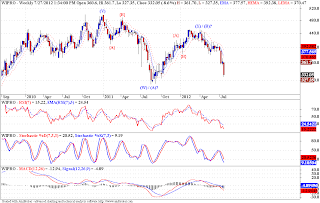
The chart below is a weekly chart for Wipro, and much like the Infy chart, provides two possible wave structures, either, and series of zigzags or a simple flat correction, with wave (C) in progress, which should be nothing short of devastating, in coming months. I have already said the situation is scary in Infy, and this analysis only adds to the fright!!
 |
| Weekly |


Thank u sir
ReplyDeleteBut WIPRO is currently oversold highly in daily charts & also in weekly. Can it join with NIFTY when it shoots up ?
ReplyDeleteThanks once again
Sure Wipro will bounce and so will almost all the stocks if Nifty rises from here. But the key is that the bounces are expected to be 3 wave corrective structures, good places to go short again.
Delete