 |
| Weekly Chart |
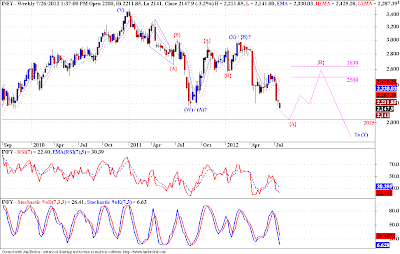
This is the weekly chart of Infy. As we had outlined in a couple of preceding posts on Infy (Post I / Post II), the prices are expected to touch the 2025 mark before any meaningful bounce occurs. But both the previous posts, were sans any wave labels. I just wanted to show that once the "Elliott Touch" acquires you, you don't need wave labels all the time, to make some accurate and profitable forecasts. So what I have done now is added some wave labels to the Infy chart, and the picture that is emerging is scary to say the least. The weekly chart above suggests that we have completed a clear 5 wave advance (on a very large fractal) at 3499 on 7 Jan 2011. Since then we are correcting steadily. Te best possible label that I could put on the chart was that of a developng DZZ (Double Zigzag). We have already completed the wave (W), already risen in wave (X) and are now forming wave {A} of (Y). This wave {A}, as mentioned already in the previous post is expected to bottom around the 2025 levels, and prices are steaduly charting their course towards that level. Once wave {A} is done we can expect some bounce in wave {B}. So far so good. By now you must have also observed the alternate labels of (A)?-(B)?-(C)? possibility. This is what is scary about this situation. Now if we are in the wave (C)? of this correction, we may just be in the worst part of the decline, and this 2025 level might provide little or no support at all, and we might continue the current free fall for some time to come.
The daily chart below paints a dreadful possibility, if observed carefully, both the consolidations marked by ovals, show a similar overall structure, which means the guideline of alternation has not been followed very clearly here, which means, we might be in a 1-2/1-2 formation, and we all know the outcome of such a pattern. Some preliminary studies suggest a possible target of 1200 - 900 on Infy. But I would warn you against taking this forecast too seriously, as it is on a very long term fractal. Right now in the short term, and on the foreseeable and trade able future I am looking at the 2025 level, to get some idea of the future course of this scrip.
 |
| Daily Chart |


No comments:
Post a Comment
...I am thrilled to learn what you think about this piece of content...