 |
| Banknifty |
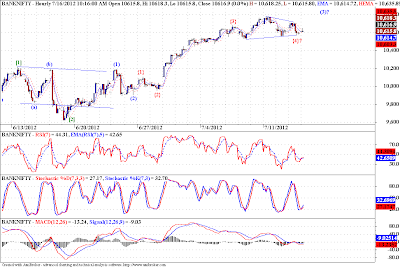
The Banknifty chart above shows a possible triangle formation, according to it, we may have left at least one more dash to the upside, commonly known as "thrust from the triangle". On the other hand Nifty may be forming an irregular flat marked by labels {1}? - {2}?, which is my alternate count, but looking at the Banknifty chart looks more likely. I talked about the support zone around 5250 - 5220, which is still in contention. But prices need to reverse up soon to keep that count alive. Another count, my preferred one, suggests that we are in a sharp wave (4), but as per EWP rules, we cannot go below the top of wave (1), at 5170. So far as that level is protected, we can move up. On Banknifty chart though the trend is clearer, and the 5 wave sequence is not yet complete, so the best ploy is to wait and watch, keep stop losses in place.
One thing the readers might note that, you can use two correlated markets to get a better grip on the wave counts, like in this case, Nifty is not very clear, but Banknifty might help us discern the wave structure.
 |
| Nifty |


No comments:
Post a Comment
...I am thrilled to learn what you think about this piece of content...