 |
| Weekly Chart |
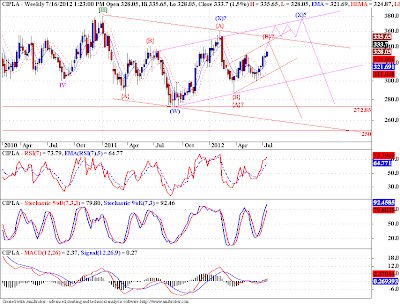
This is the chart of Cipla, at first the charts and trend lines look overwhelming, but a more patient observation would reveal interesting possibilities. We are rising after completing a 3 wave down move at the label marked (W). Now the (X)? wave might have completed already around 360 levels, and then we fell in wave {A}? down and presently rising in wave {B}? in 3 waves, in red channel. After completion of this wave {B}? around 340 levels, we may start down on wave {C}? of (Y). This is my alternate count.
The preferred count suggests that we are following the pink channel, and we are currently rising in wave III of {C} of (X), which may complete around 380 levels. The path is marked in pink lines. Both the counts suggest that we have to test the 270 - 250 band, either after getting resisted at 340, or if we take out the 340 level, then after getting resisted at 380.
My personal bet is that we may get resisted at 380 and then fall. But its always better to follow the market, that predict them.
On the daily chart below, we are following the blue channel, if we break out from the blue channel, we are sure to test the 380 levels. On the contrary if we get resisted at top boundary of blue channel around 340, we may play out the alternate scenario.
 |
| Daily Chart |


No comments:
Post a Comment
...I am thrilled to learn what you think about this piece of content...