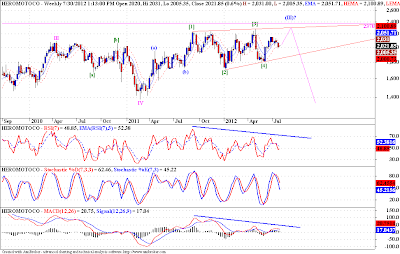
This is a weekly chart of Heromoto, I am trying to label an ending diagonal pattern. There is a possibility of a last rally (dying gasp) in Nifty, and the same could translate in Heromoto as the last leg of the ED pattern. We know that ED patterns precede violent reversals in prices. Earlier I had posted a bullish view on Heromoto, but subsequent developments in prices have tilted my balance towards bearish possibilities. Once this ED completes we may see sharp reversal, and the complete potential for this correction ranges from 940-550. This count is on a very big fractal, so the price moves may take myriad ways to reach the targets, the prudent thing is to keep the big picture in mind, but follow the prices on smaller fractals.
Monday, July 30, 2012
Heromoto - Elliott Wave Analysis
Tags
# Heromoto
# Long Term
About Dean Market Profile
Dean is a fulltime trader for last 13 years. He is passionate about technical analysis. His instruments of choice are Nifty and banknifty futures and options. His main analysis and trading tools include advanced techniques like Market Profile, Voilume Spread Analysis and Order FLow Analysis. Dean is a teacher at heart and loves sharing his learnings with committed traders. You can check out his courses here...
Stocks
Subscribe to:
Post Comments (Atom)


No comments:
Post a Comment
...I am thrilled to learn what you think about this piece of content...