 |
| Weekly Chart |
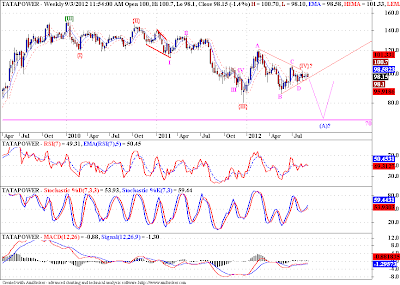
Tatapower is falling since the top made in Jan 2010. Initially I was under impression that we are in a 3 wave counter trend move, and the whole correction might take the shape of a flat correction. But subsequent price action is suggesting something different. As shown in the above chart, there is a good possibility that we might be forming a triangle in wave {IV} and actually there might be one more down leg remaining, towards the 70 levels. A break of the B-D trend line will be initial warning that the downtrend has started, further credibility will be added when we take out the low of wave D at 92. The invalidation level for this count is 103.
 |
| Daily Chart |
Of course I am going to discuss an alternate count, because I am more worried about protecting my capital than increasing it. Because if one stays long enough in the game, one would get the knack of it.
Anyways the alternate count puts the recent consolidation as a triangle in wave {B}. Which means we should be rising back up once this triangle resolves. 92.05 is the invalidation level for this scenario. All the indicators are hovering around zero or 50 levels, which again is the sign of prices trading in a narrow range. But this range will resolve and will result is a trad able move.
I would suggest patience till we get a resolution of this trading range, and then take a call. If we stick to tight to our own view, rather than looking at what the charts are showing us, our trading actions will get biased, and that is not a good trait for a trader.


No comments:
Post a Comment
...I am thrilled to learn what you think about this piece of content...