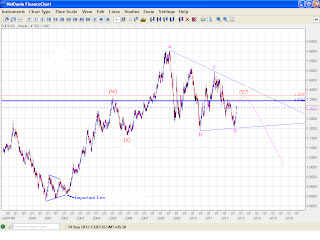
This is weekly chart for EURUSD. I am counting a double three correction in progress in EURUSD from the important low marked in the lower left corner of the chart. We may have completed 4 waves of the triangle formation in wave {Y}, and the current rise seems to be wave E of {Y}. There is a possibility that wave E might become more complex, but the resistance zone for wave E comes in the range of 1.3422 to 1.3688. I would be very cautious if we reach this level. The normal action point for a triangle is the break of trend line B-D, but since this is a weekly chart, I would like to look for reversal patterns on lower fractals once we reach the said resistance zone.
Wednesday, September 19, 2012
EURUSD - Elliott Wave Update
About Dean Market Profile
Dean is a fulltime trader for last 13 years. He is passionate about technical analysis. His instruments of choice are Nifty and banknifty futures and options. His main analysis and trading tools include advanced techniques like Market Profile, Voilume Spread Analysis and Order FLow Analysis. Dean is a teacher at heart and loves sharing his learnings with committed traders. You can check out his courses here...
Updates
Categories:
Currencies,
Elliott Wave,
EUR USD,
Updates
Subscribe to:
Post Comments (Atom)


No comments:
Post a Comment
...I am thrilled to learn what you think about this piece of content...