 |
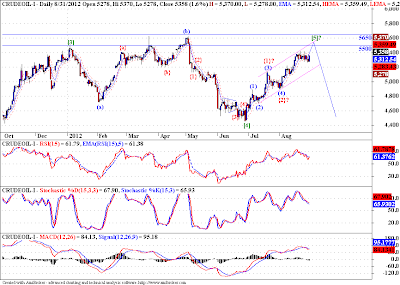
| Crude Oil Daily Chart |
Crude is rising impulsively, one of the scenarios calls for a top in the 5500-5650 range on Crude. That is the scenario of wave (5) of [5] extending. Whereas according to the alternate scenario wave (3) may be subdividing. Both these scenarios call for further price rise in the Crude prices.
 |
| Gold Daily Chart |
I don't track Gold, but i could not but help myself from spotting a triangle pattern completed in Gold, marked by wave [4]. Now What followed the triangle resembled an ending diagonal. But since we have taken out the top of that ending diagonal, we can expect further upside in Gold. The ending diagonal actually turned out to be wave (1) of [5]. Gold seems to have some more upside left in it. But as a precaution we should be cautious at 32065 on Gold spot. The reason for this possible resistance is, a triangle is spotted in fourth, X and B waves. Of which waves 4 and B should result in an impulsive move, but wave X is often followed by a zigzag in a double or triple zigzag combination. But if we take out the 32065 levels with ease, we can be sure that this up move is going to be an impulse.


No comments:
Post a Comment
...I am thrilled to learn what you think about this piece of content...