 |
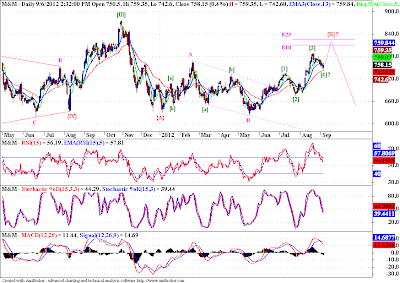
| Daily Chart |
M&M might put in a major top at 877.30 in Oct last year. Since the top M&M fell sharply in 5 waves, and then began the laborious process of correcting that fall. The pattern that is forming is the expanded flat, and we may be in the last wave of that pattern. The daily chart above shows the count in detail. I believe we have one more wave to the upside left before we start falling again. This last wave coincides with the last expected wave in Nifty. The probable targets for this wave [5] of C of {B} comes in the range of 810-25. If we reach there we will look at this counter again.
 |
| 4 Hourly Chart |


No comments:
Post a Comment
...I am thrilled to learn what you think about this piece of content...