 |
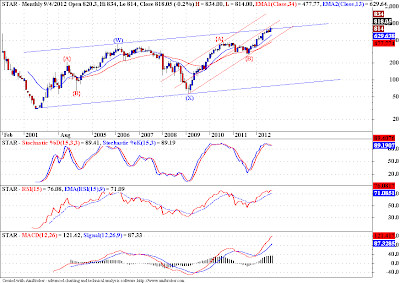
| Monthly Chart |
This is the best count I could fit on the chart of STAR (Strides Arcolab), I don't track this stock, so it may happen that I change my mind if price action demands it. But right now I can see 2 channels one blue one red and both the channels are suggesting that the near future is going to be difficult for this ticker. Both channels are offering resistance to prices, and since the whole rise was a corrective structure it should be completely retraced. Now that may be a scary thought and completely out of place at this moment, but that is what my preliminary analysis is telling me.
But once again I would like to state the fact that I don't track this ticker, and this count is subject to change if price action demands it.
The detailed count on lower fractals is shared below.
 |
| Weekly Chart |
 |
| Daily Chart |


No comments:
Post a Comment
...I am thrilled to learn what you think about this piece of content...