 |
| Monthly Chart |
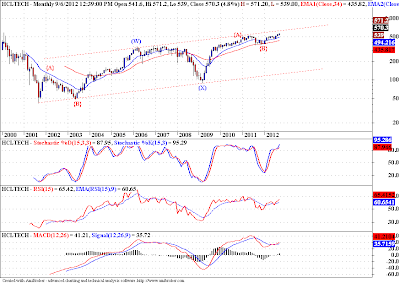
HCL Tech is one of the few stocks which is braving the down move in Nifty. While Nifty is moving sideways this stock is scaling new highs, the stock is at the highest levels in decades. But alas the move does not look like an impulse, in fact it looks like we are forming a DZZ since the low made in late 2001. Lets take a look at the wave internals on lower fractals.
 |
| Weekly Chart |
The weekly chart above shows the the wave (Y) in detail. I am using a log scale so don't get the impression that wave {C} is very small compared to wave {A}. Yes it is around 50% mark of wave {A}. And I suspect it may top in between 61.8% - 50% mark of wave {A}, the range comes around 590 - 640. Right now we are trading around 570 odd levels.
 |
| Daily Chart |
The daily chart shows the wave {C} in detail. WE seem to have completed waves I-II-III-IV and are currently in wave V, which might extend. The target for extended wave V comes at 600 levels where wave V == (0 - III). That sits pretty well with our target zone for wave {C}. Since we are dealing with very large fractals the target may vary a little, but the form so far looks like a DZZ.
Note: I wont pronounce this stock as a sorting candidate, but at least long term investors of those who were late to the party should think about protecting their accumulated profits and or capital.


No comments:
Post a Comment
...I am thrilled to learn what you think about this piece of content...