 |
| 4 Hourly Chart |
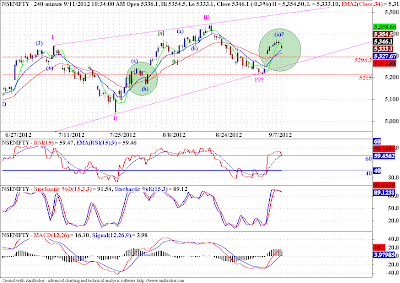
This might be a bit early, but I can see a similar looking pattern recuring on the chart of Nifty. The initial pattern ofcourse on the left side is circled in green, and the one mocking it is circled in green but on the right side. These are the salient points of similarities in these patterns,
1. LP - 13 DEMA crossed 34 DEMA RP - 13 DEMA corssed 34 DEMA
2. LP - Prices pulled back to EMAs RP - Prices pulling back to EMAs.
3. LP - RSI turned between 60-40 RP - RSI pulling back to 60-40 range.
4. LP - STS in OB zone, moving sdeways RP - STS in OB zone, moving sideways.
5. LP - MACD crossed 0, formed a hook RP - MACD crossed 0, hook not yet formed.
LP - Left Pattern, RP - Right Pattern, OB - Overbought
Note: Text marked in red suggests that the current pattern is not yet complete.
If there is any truth to the adage, "history repeats itself", then this constitutes a great example in the making. Though this is not a trading recommendation, just an observation, but since EWP is suggesting an up move, such stark similarities to previous price action with some compelling TA evidence, it is worth a shot.


No comments:
Post a Comment
...I am thrilled to learn what you think about this piece of content...