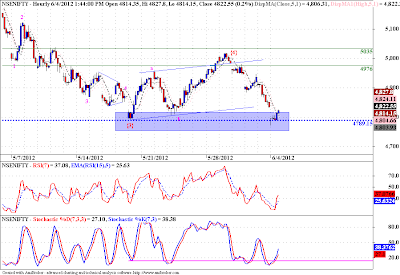
Prices have actually turned down from the exact price band we discussed prior to prices even reaching that price zone. Though Elliott Wave Theory is a potent tool that gives such moments of pin point accuracy, we might as well have gotten lucky! That said, we can see that prices have actually dipped below the low made by wave {3} in this hourly chart, that is the minimum requirement for any wave {5}, but looking at the sub waves of this wave {5}, we cannot say convincingly that this wave {5} is done, a good positive divergence is developing on daily chart, but we might test the 4700 levels before we turn up for a meaningful rise. So as we got vigilant at the resistance zone a few days back, we should be on our toes as prices approach the 4700 zone. If we let prices tip their hand first, who knows we might get lucky again.
Monday, June 04, 2012
Nifty - Elliott Wave Analysis
Tags
# Elliott Wave
# Indices
About Dean Market Profile
Dean is a fulltime trader for last 13 years. He is passionate about technical analysis. His instruments of choice are Nifty and banknifty futures and options. His main analysis and trading tools include advanced techniques like Market Profile, Voilume Spread Analysis and Order FLow Analysis. Dean is a teacher at heart and loves sharing his learnings with committed traders. You can check out his courses here...
Nifty
Categories:
Elliott Wave,
Indices,
Nifty
Subscribe to:
Post Comments (Atom)


No comments:
Post a Comment
...I am thrilled to learn what you think about this piece of content...