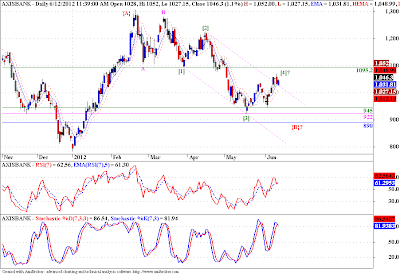
Axis Bank has seen a rise recently from the lows of 922 levels, which for all practical purposes looks corrective in nature. What it means is we may see another bout of selling in this stock to complete the wave [5] of C of {B} in the 945 to 890 range. Its a wide range, but if we count the waves on the lower fractal correctly we can get a pretty good idea as to where we can see the end to this wave [5]. And just to be alert to alternate possibilities, if we break out above the 1095 level, this wave [5] scenario gets negated and we will have to relabel the waves. Then we will have to say that the wave {B} has ended in the 945 - 922 range, and we are of to wave {C}. One can place himself on the short side, with a SL above yesterday's high of 1072, and a SAR above 1095.20.
Tuesday, June 12, 2012
Axis Bank - Elliott Wave Analysis
Tags
# Axisbank
# Stocks
About Dean Market Profile
Dean is a fulltime trader for last 13 years. He is passionate about technical analysis. His instruments of choice are Nifty and banknifty futures and options. His main analysis and trading tools include advanced techniques like Market Profile, Voilume Spread Analysis and Order FLow Analysis. Dean is a teacher at heart and loves sharing his learnings with committed traders. You can check out his courses here...
Stocks
Subscribe to:
Post Comments (Atom)


can u update axis bank chart and analysis on this stock...
ReplyDeleteand what will be the next move in this stock and nifty also...please do it i have position in this scripts.. m @ long side in both...
DeleteI am out of station, will be able to take it up only on Tue. In the mean while you'll be well advised to maintain stop loss.
Deletecan u update on axis bank please...
Delete