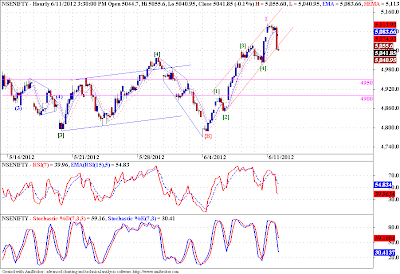
A clear cut 5 wave move can be seen on the chart, and prices have crossed above wave [4]. Now prices should see a corrective move, and probable range for prices should test the 4950 - 4900 range. We have broken down the channel, we can see a negative divergence on RSI and STS, on waves 3 and 5. All this suggests that prices should rest for a while, and so should we. Wait for a "recognizable" Elliott Wave Pattern to complete, and then place yourself on the long side. However if prices trade below 4850 this upward count will be in question!
Monday, June 11, 2012
Nifty - Elliott Wave Analysis
Tags
# Elliott Wave
# Indices
About Dean Market Profile
Dean is a fulltime trader for last 13 years. He is passionate about technical analysis. His instruments of choice are Nifty and banknifty futures and options. His main analysis and trading tools include advanced techniques like Market Profile, Voilume Spread Analysis and Order FLow Analysis. Dean is a teacher at heart and loves sharing his learnings with committed traders. You can check out his courses here...
Nifty
Categories:
Elliott Wave,
Indices,
Nifty
Subscribe to:
Post Comments (Atom)


No comments:
Post a Comment
...I am thrilled to learn what you think about this piece of content...