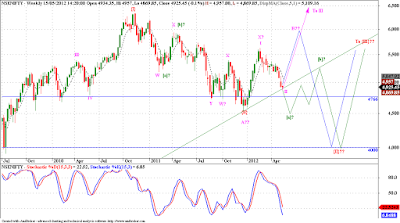
This is a weekly chart of Nifty. We can see a host of possibilities marked on it. And we cant be very sure about any one of them at this moment. But we will go through all of them one by one,
Case I
Nifty is very near to the end of correction in wave II. From these levels of 4880, we may see a dynamic rally in wave III. That is the count which we have been following as our preferred count, a caveat: even though this is my preferred count, it does not mean it is preferred by the market, so I have my fail-safe's in place and so should you. The action required in this case is pretty simple, just wait for a small 5 wave rally from these levels, wait for a small 3 wave pullback to that rally, and enter on completion of that small 3 wave pullback, also make sure we rise above the end of previous wave (4), to confirm an end to this down move. I will update important short term levels as we move along.
Case II
Here we are contemplating a double zigzag, the notations for this count are followed by single "?" mark after the wave labels. Here we may continue the fall for some more time to complete the wave [a], in the process we will break down from a long term trend line (that will add to bearishness), then rise to get resisted at the same trend line from below, and fall again, to complete the W - X - Y formation in wave {II}, around 4000 levels on Nifty. Early warning for this might come, when we break below 4766.
Case III
In this case we may form an A - B - C correction (wave labels followed by "??" mark), a simple zigzag, but wave A as a leading diagonal. In this case we may rise from current levels to a high of around 5950 - 6000 range to complete wave B, and again fall back in 5 waves to complete the wave C of {II}. This possibility may trap many bulls once it crosses above the 5630 level, which by many is considered the break out level for a new bull move. It may indeed prove to be true, anyways if we were to embark on wave III, we will have to breakout above 5630. But if prices get resisted around 5950 - 6000 range, we better be careful. As it may come back all the wave to 400 levels, and that too in a dynamic wave C. The wave {3} of C will be especially severe.


No comments:
Post a Comment
...I am thrilled to learn what you think about this piece of content...