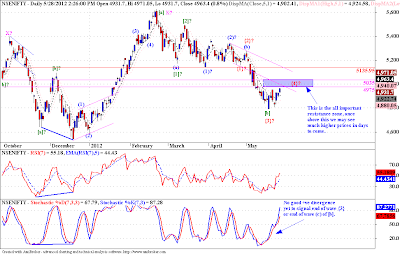
Nifty has risen upto the resistance zone of 4975 - 5035. Everything will depend upon how prices behave at this level. If we break above it the bullish scenario comes into play, and we may see good price rise from current levels. But if we get resisted at this zone then, then we may see much lower prices. There is one more resistance to prices the lowe channel boundary, shown in pink lines, so we are at an important junction point, interesting time ahead.
Monday, May 28, 2012
Nifty - Elliott Wave Analysis
Tags
# Elliott Wave
# Indices
About Dean Market Profile
Dean is a fulltime trader for last 13 years. He is passionate about technical analysis. His instruments of choice are Nifty and banknifty futures and options. His main analysis and trading tools include advanced techniques like Market Profile, Voilume Spread Analysis and Order FLow Analysis. Dean is a teacher at heart and loves sharing his learnings with committed traders. You can check out his courses here...
Nifty
Categories:
Elliott Wave,
Indices,
Nifty
Subscribe to:
Post Comments (Atom)


hi aniruddha .i am amar here . why are u trying to counting 1-2-3-4-5 in corrective wave? we have allready seen 5 wave incline from 4530 to 5630
ReplyDeletethat was wave i .nifty then corrected in double zigzag pattern w-x-y of which x was running symmetrical traingle . now we are in iii rd strongest wave This is my wave count .do reply
Dear Amar,
DeleteI have gone through your chart, your wave markings are good. Coming back to my count, well the chart you saw was one of the possible counts, I tend to keep atleast 2 - 3 alternate counts, as it is more important to trade right than getting right wave counts. I use EWT guidelines to trade using different possible wave counts. My goal is to avoid surprises in the markets, and be prepared all the time.
Also I have a suggestion for you, please share wave counts of atleast 3 successive degrees, to help readers understand your count better.
Good Luck
Aniruddha