 |
| Bearish View |
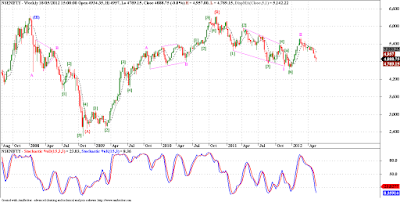
In this post I am discussing both bullish and bearish long term counts for Nifty. Above chart is bearish. We are forming a flat correction, and may be completed a wave I (leading diagonal), followed by an irregular correction. Now may be we are starting the dreaded wave III down. The fun part is the normal / minimum target for wave III comes around 2900. Again I am in the mode, where I tend to give extreme bullish and bearish targets, this is purely from an academic perspective. I am a trader, and these long term views only serve as a backdrop to my short term trading actions. Please use your own judgement while using this analysis for making Investment decisions. Now that we have talked about the bearish view, lets take a look at the bullish view.
 |
| Bullish View |
Here is a bullish chart for long term, we may drop till 4000 levels, still. Or may rise from these levels, itself. In this scenario we are forming a wave {II} of wave (V). So we have big big gains ahead of us, if we indeed take this path and eventually start the wave {III} of (V).
I don't tend to confuse my view point with fundamental data, and conforming with other theories. There are many people who do a better job of it. I feel we have two possibilities, and eventually the price action itself will clear what path the market will take. Please refer the short term updates for trading action. And please share your views if you have supporting or opposing arguments to my market view. Also if you have any theories or information to share, please feel free to share it on my blog.


No comments:
Post a Comment
...I am thrilled to learn what you think about this piece of content...