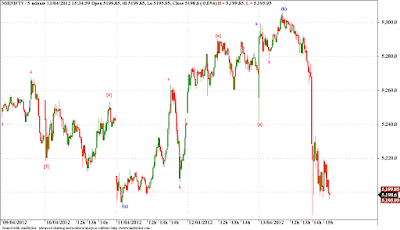
Nifty completed the wave (a) which started last week after we got resisted at 5380 levels. The wave (a) took support around 5200 levels and staged a smart rally to complete the wave (b) just around the falling trend line. Yesterday's fall was dramatic, and was fueled by the poor results and performance of IT stocks giant Infy. We expect the price to move down further from these levels, and should head for the region of 5100 - 5075 levels. This band should provide some clue as to the future direction of this move. Our Elliott wave count suggests we are falling in wave (c) of [z] of II. If prices take support at the 5100 - 5075 zone, and lowest at 4950 levels then we can resume the up trend, but if we break down from these levels then this bullish count has to be revisited. Minimum target for this downmove will be below 5135, to complete the pattern.
Saturday, April 14, 2012
Nifty - Weekly Wrap Up
Tags
# Elliott Wave
# Indices
About Dean Market Profile
Dean is a fulltime trader for last 13 years. He is passionate about technical analysis. His instruments of choice are Nifty and banknifty futures and options. His main analysis and trading tools include advanced techniques like Market Profile, Voilume Spread Analysis and Order FLow Analysis. Dean is a teacher at heart and loves sharing his learnings with committed traders. You can check out his courses here...
Nifty
Categories:
Elliott Wave,
Indices,
Nifty
Subscribe to:
Post Comments (Atom)


No comments:
Post a Comment
...I am thrilled to learn what you think about this piece of content...