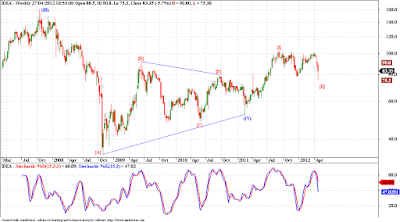
Bharti Chart left some doubts, but Idea chart has helped clear the clouds. We can see a good triangle forming on Idea chart, and since triangles are patterns mostly seen in 4th waves and B waves, we can expect either a 5th wave or a C wave following a triangle. Both 5th and C waves are motive waves, and most likely impulses, atleast the sub waves of these waves are going to be impulses. So on a shorter time frame Idea needs to complete another round of selling towards the 71.50 levels before we ca n call and end to this corrective move. Consequently we should rally in wave {III}, and technically should atleast reach the top of wave (III) or (A). That augurs well for this stock and once the expected last wave of selling is done we should resume the up trend. The invalidation points for this count are 71.50 and 63.00, below which the stock should fall much much more. But remember, one more round of selling is pending in this stock.
Friday, April 27, 2012
Idea - Elliott Wave Analysis
About Dean Market Profile
Dean is a fulltime trader for last 13 years. He is passionate about technical analysis. His instruments of choice are Nifty and banknifty futures and options. His main analysis and trading tools include advanced techniques like Market Profile, Voilume Spread Analysis and Order FLow Analysis. Dean is a teacher at heart and loves sharing his learnings with committed traders. You can check out his courses here...
Stocks
Subscribe to:
Post Comments (Atom)


No comments:
Post a Comment
...I am thrilled to learn what you think about this piece of content...