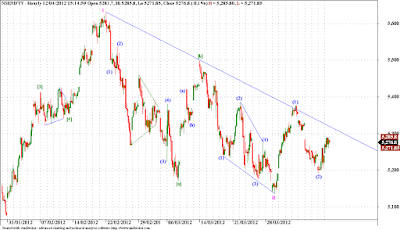
Nifty is close to the falling trend line (blue color), if we break out above this falling trend line, we may say that the correction is over and the least target for this upmove will be in the range of 5400, and if this is the starting point of this new move then we will see much higher prices in coming days and weeks. No we just have to wait and see if we take resistance at this trend line or just break through above it.
Thursday, April 12, 2012
Nifty - Elliott Wave Analysis
Tags
# Elliott Wave
# Indices
About Dean Market Profile
Dean is a fulltime trader for last 13 years. He is passionate about technical analysis. His instruments of choice are Nifty and banknifty futures and options. His main analysis and trading tools include advanced techniques like Market Profile, Voilume Spread Analysis and Order FLow Analysis. Dean is a teacher at heart and loves sharing his learnings with committed traders. You can check out his courses here...
Nifty
Categories:
Elliott Wave,
Indices,
Nifty
Subscribe to:
Post Comments (Atom)


No comments:
Post a Comment
...I am thrilled to learn what you think about this piece of content...