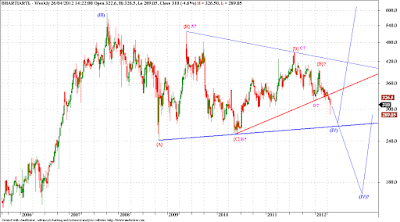
Bharti is offering a dual interpretation. Both are triangle patterns, but one cant be too sure about whether it is a wave (IV) triangle or a wave {B} triangle in wave (IV). Interesting!! We can spot the wave labels without the question mark behind them, that is my preferred count. One which suggests that we are in wave {E} of (IV), and prices should zoom once we are through with wave {E}. But the one with question marks is the alternate count which suggests that the triangle was actually in wave {B} of (IV), and prices should come down in wave {C} of (IV). The decider is actually the first wave down, marked {A}, it is clearly corrective, and can easily be the first wave of a triangle wave (IV), and in that case we should soon see prices zooming up, the failure point for this count is of course the low of wave {C}at 252. Right now I wont bet on prices falling too much, at least not below the lower boundary if the wave (IV) triangle (thick blue line). However if we get resisted at the red line and start falling again, we may see much lower prices in times to come.
Thursday, April 26, 2012
Bharti - Elliott Wave Analysis
About Dean Market Profile
Dean is a fulltime trader for last 13 years. He is passionate about technical analysis. His instruments of choice are Nifty and banknifty futures and options. His main analysis and trading tools include advanced techniques like Market Profile, Voilume Spread Analysis and Order FLow Analysis. Dean is a teacher at heart and loves sharing his learnings with committed traders. You can check out his courses here...
Stocks
Subscribe to:
Post Comments (Atom)


No comments:
Post a Comment
...I am thrilled to learn what you think about this piece of content...