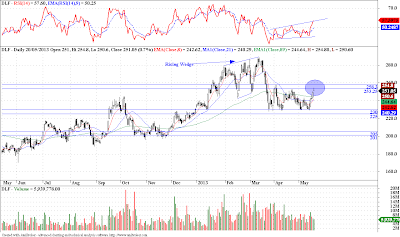
- Above is a daily chart for DLF, the counter has spiked perfectly in the resistance zone, refer previous post here.
- We may see prices traveling all the way down to the lower band of this trading range.
- One may notice a peculiar pattern in the RSI indicator.
- Reliance is looking like it has managed a corrective rally, I had pointed out that prices may trudge higher (refer previous post here), but now the pattern looks complete.
- Also one might notice that this complete rally looks like it is a part of the right shoulder of a big HnS pattern.
- If this is true, then we are in for an immediate downmove till the NL, and below which we may see prices falling even further.


No comments:
Post a Comment
...I am thrilled to learn what you think about this piece of content...