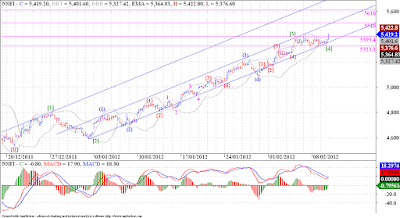
This hourly chart shows that we have completed an almost 3 and 1/2 day correction, in possibly wave [4]. Now we have broken out of the 5325 - 5400 range after 3 and 1/2 days, so we can expect this up move to carry some distance, before it loses steam. I have 5510 - 5610 in sight in the near term. But we need to remain above 5400 for this view to materialize, if we slip back into the trading range again, then this sideways action may continue further.
This 10min chart shows the details of this double three pattern which formed on Nifty. We can see a flat followed by a zigzag and finally finished up by a triangle. Such sideways patterns suggest exceptional strength in the markets and we may exploit the maximum target potential for this wave [5]. Also an important point here is that if this double three pattern was indeed wave [4], we have not even completed 14.6% correction of wave [3], now that may happen because of exceptional strength of wave [3] of exceptionally strong 'anticipated' wave [5]. Only time will tell what actually will happen.


No comments:
Post a Comment
...I am thrilled to learn what you think about this piece of content...