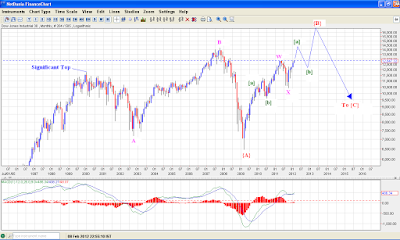
This chart DJI monthly chart shows a possible complex correction possibility a double three. We completed an undisputed flat correction in 2008, and since then we are rising in steady fashion in what might be an intervening X wave in a complex correction. Here it is labeled as wave {B}. Since first wave {A} was an irregular flat this wave {B}is particularly strong borrowing the strength from the preceding flat formation and might be forming a DZZ correction. Upon completion of wave {B} we might form a wave {C} which might take many possible formations, it may form a triangle, or a simple impulse, which will be particularly sharp, and will target the lows of 2008, or an ending diagonal. But all this will take considerable time. In the short term though we have to take market action one wave at a time. So lets look at the daily chart.
On this daily chart we can see a possible bullish count where we are forming a series of 1 - 2 / 1 - 2 waves, which should ultimately lead to a blast to the upside, in wave 3 of 3 of 3, but this count though not impossible, does not account for the current global economic scenario. But if the count on the monthly chart above is playing out then we are actually forming wave [a] of the second ZZ of the DZZ correction in wave {B}, to be followed by the dreaded wave {C}. One thing is for sure, the more delayed this inevitable collapse is, the more severe it will be. But right now, baring minor corrections in the context of this long term complex formation, we are headed up, and as always it is advisable to take the market action ONE WAVE AT A TIME!!!!!


No comments:
Post a Comment
...I am thrilled to learn what you think about this piece of content...